Quick Guide to Application Monitoring with Spring Boot + Prometheus + Grafana + Docker

Overview
This guide configures Spring Boot Actuator to expose Metrics, sends those metrics to Prometheus, and visualizes them in Grafana.
Create a Spring Boot Project
First, create a Spring Boot project that will expose metrics for Prometheus.
Command to create a new project
Use the curl command below to create a new Spring Boot project.
curl https://start.spring.io/starter.tgz \
-d bootVersion=2.7.6 \
-d dependencies=web,actuator,prometheus \
-d baseDir=spring-actuator-prometheus \
-d groupId=com.devkuma \
-d artifactId=spring-actuator-prometheus \
-d packageName=com.devkuma.prometheus \
-d applicationName=ActuatorPrometheusApplication \
-d javaVersion=11 \
-d packaging=jar \
-d type=gradle-project | tar -xzvf -
This command uses Java 11 and Spring Boot 2.7.6, and adds the web, actuator, and prometheus dependencies.
Check dependencies in the build file
build.gradle
dependencies {
	implementation 'org.springframework.boot:spring-boot-starter-actuator'
	implementation 'org.springframework.boot:spring-boot-starter-web'
	runtimeOnly 'io.micrometer:micrometer-registry-prometheus'
	testImplementation 'org.springframework.boot:spring-boot-starter-test'
}
spring-boot-starter-actuatorprovides access to Spring Boot application information.- Since Spring Boot 2.0, Actuator includes Micrometer support for measuring application metrics.
micrometer-registry-prometheusprovides metrics that Prometheus can read.- This library converts metrics produced by Micrometer into a metric format that a Prometheus server can use.
Configure the Actuator endpoint
In Spring Web, Actuator provides an additional endpoint so that a Prometheus server can pull application metric information generated through Micrometer.
Actuator can configure the list of endpoints exposed under /actuator through the management.endpoints.web.exposure.include option in application.yml.
/src/main/resources/application.yml
management:
  endpoints:
    web:
      exposure:
        include: health, prometheus
Here, the default health endpoint and the Prometheus endpoint are exposed.
Check the endpoint list provided by the application
Run the application and open http://localhost:8080/actuator to check the list of endpoints provided by Actuator.
{
    "_links": {
        "self": {
            "href": "http://localhost:8080/actuator",
            "templated": false
        },
        "health-path": {
            "href": "http://localhost:8080/actuator/health/{*path}",
            "templated": true
        },
        "health": {
            "href": "http://localhost:8080/actuator/health",
            "templated": false
        },
        "prometheus": {
            "href": "http://localhost:8080/actuator/prometheus",
            "templated": false
        }
    }
}
At http://localhost:8080/actuator/prometheus, you can check the metrics collected through Micrometer.
# HELP tomcat_sessions_active_current_sessions
# TYPE tomcat_sessions_active_current_sessions gauge
tomcat_sessions_active_current_sessions 0.0
# HELP jvm_gc_pause_seconds Time spent in GC pause
# TYPE jvm_gc_pause_seconds summary
jvm_gc_pause_seconds_count{action="end of minor GC",cause="Metadata GC Threshold",} 1.0
jvm_gc_pause_seconds_sum{action="end of minor GC",cause="Metadata GC Threshold",} 0.006
# HELP jvm_gc_pause_seconds_max Time spent in GC pause
# TYPE jvm_gc_pause_seconds_max gauge
jvm_gc_pause_seconds_max{action="end of minor GC",cause="Metadata GC Threshold",} 0.006

... omitted ...
Each entry is displayed as a metric that Prometheus can recognize, such as tomcat_sessions_active_current_sessions and jvm_gc_pause_seconds_count, and you can also check the HELP and TYPE information above each metric.
Prometheus Server
Now that the application is ready, prepare a Prometheus server to collect the metrics generated by the application.
This guide uses Prometheus installed in Docker. For Prometheus Docker installation, refer to this page.
Configure the Prometheus server
When starting the Prometheus server, configure the settings file (prometheus.yml) as follows.
/etc/prometheus/prometheus.yml
global:
  scrape_interval: 10s # Pull metrics every 10 seconds
  evaluation_interval: 10s # Configure how often rules are evaluated
scrape_configs:
  - job_name: 'spring-actuator-prometheus'
    metrics_path: '/actuator/prometheus' # Application prometheus endpoint
    static_configs:
      - targets: ['host.docker.internal:8080'] # Application host:port
Check the Prometheus server
Now start the Prometheus Docker container and connect to Prometheus.
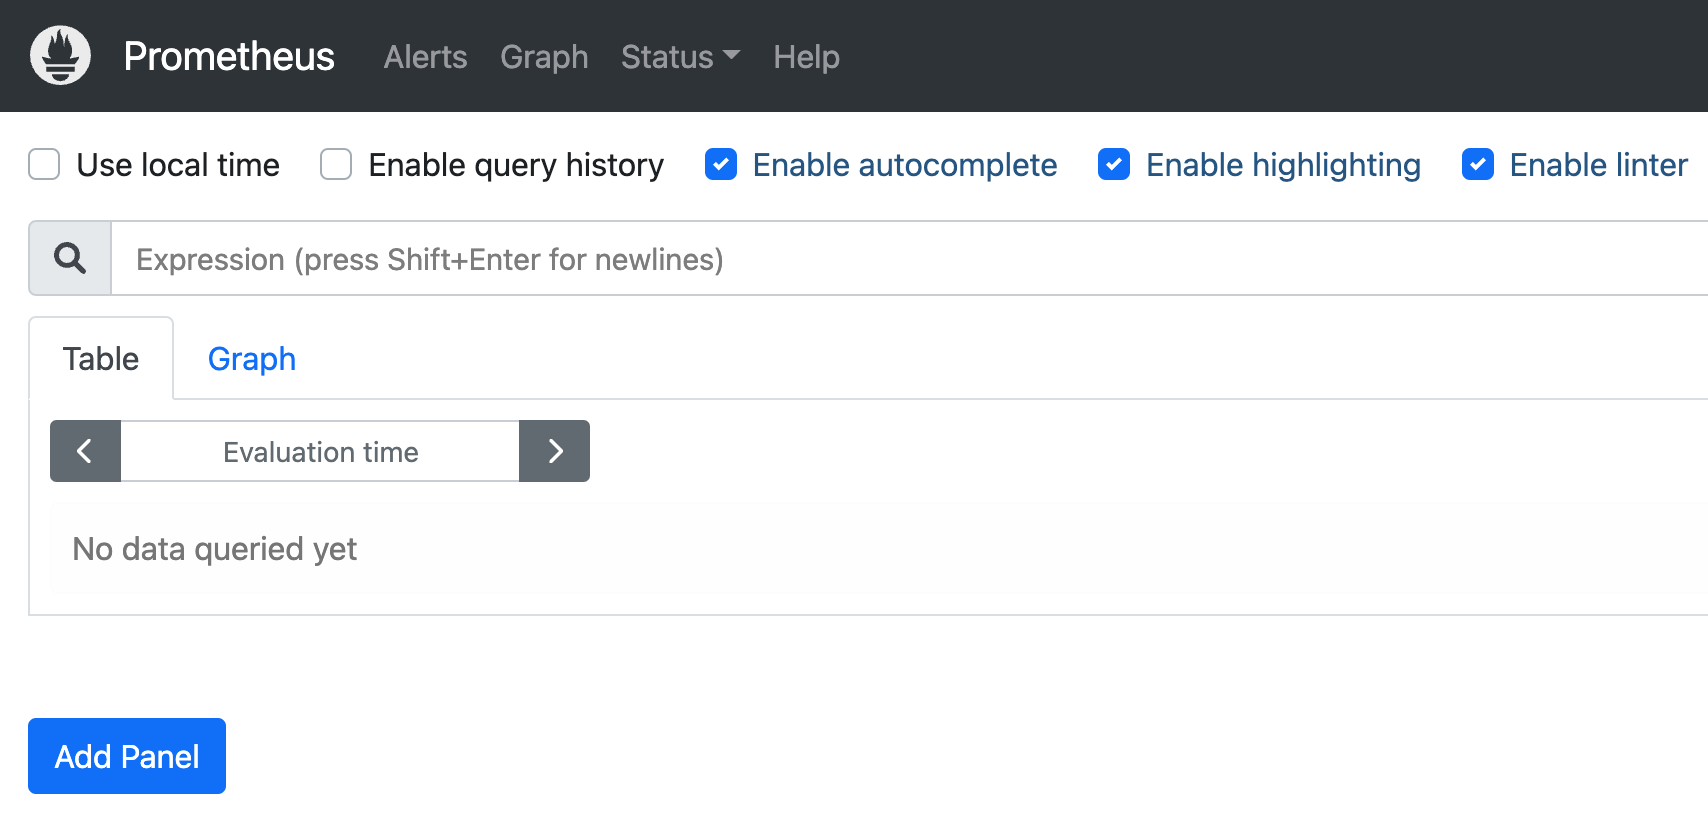
If everything above is correct, open Prometheus (http://localhost:9090) and you will see the Prometheus main screen as shown below.
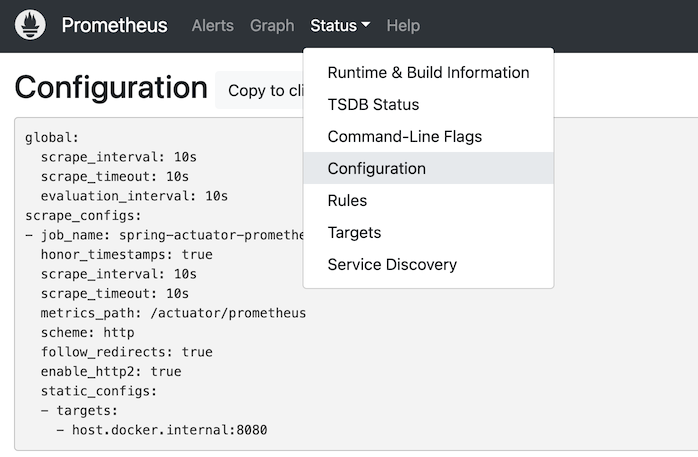
In the Status > Configuration menu, you can check whether the file configured for Prometheus has been applied.
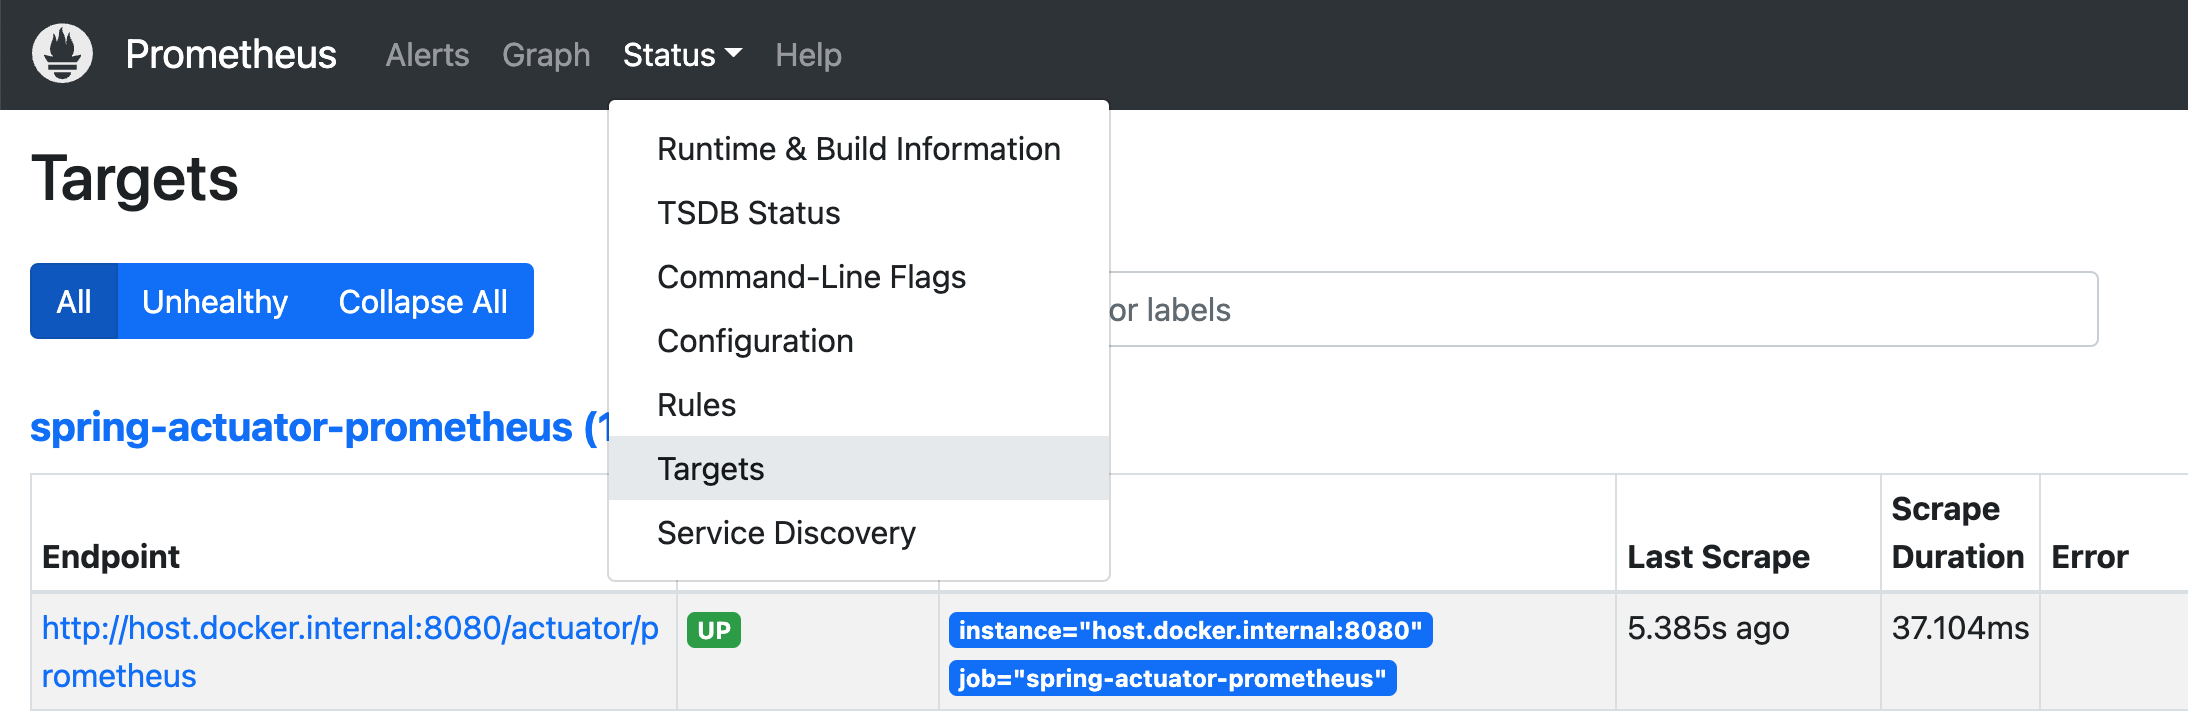
In the Status > Targets menu, you can check the status of the connected application.
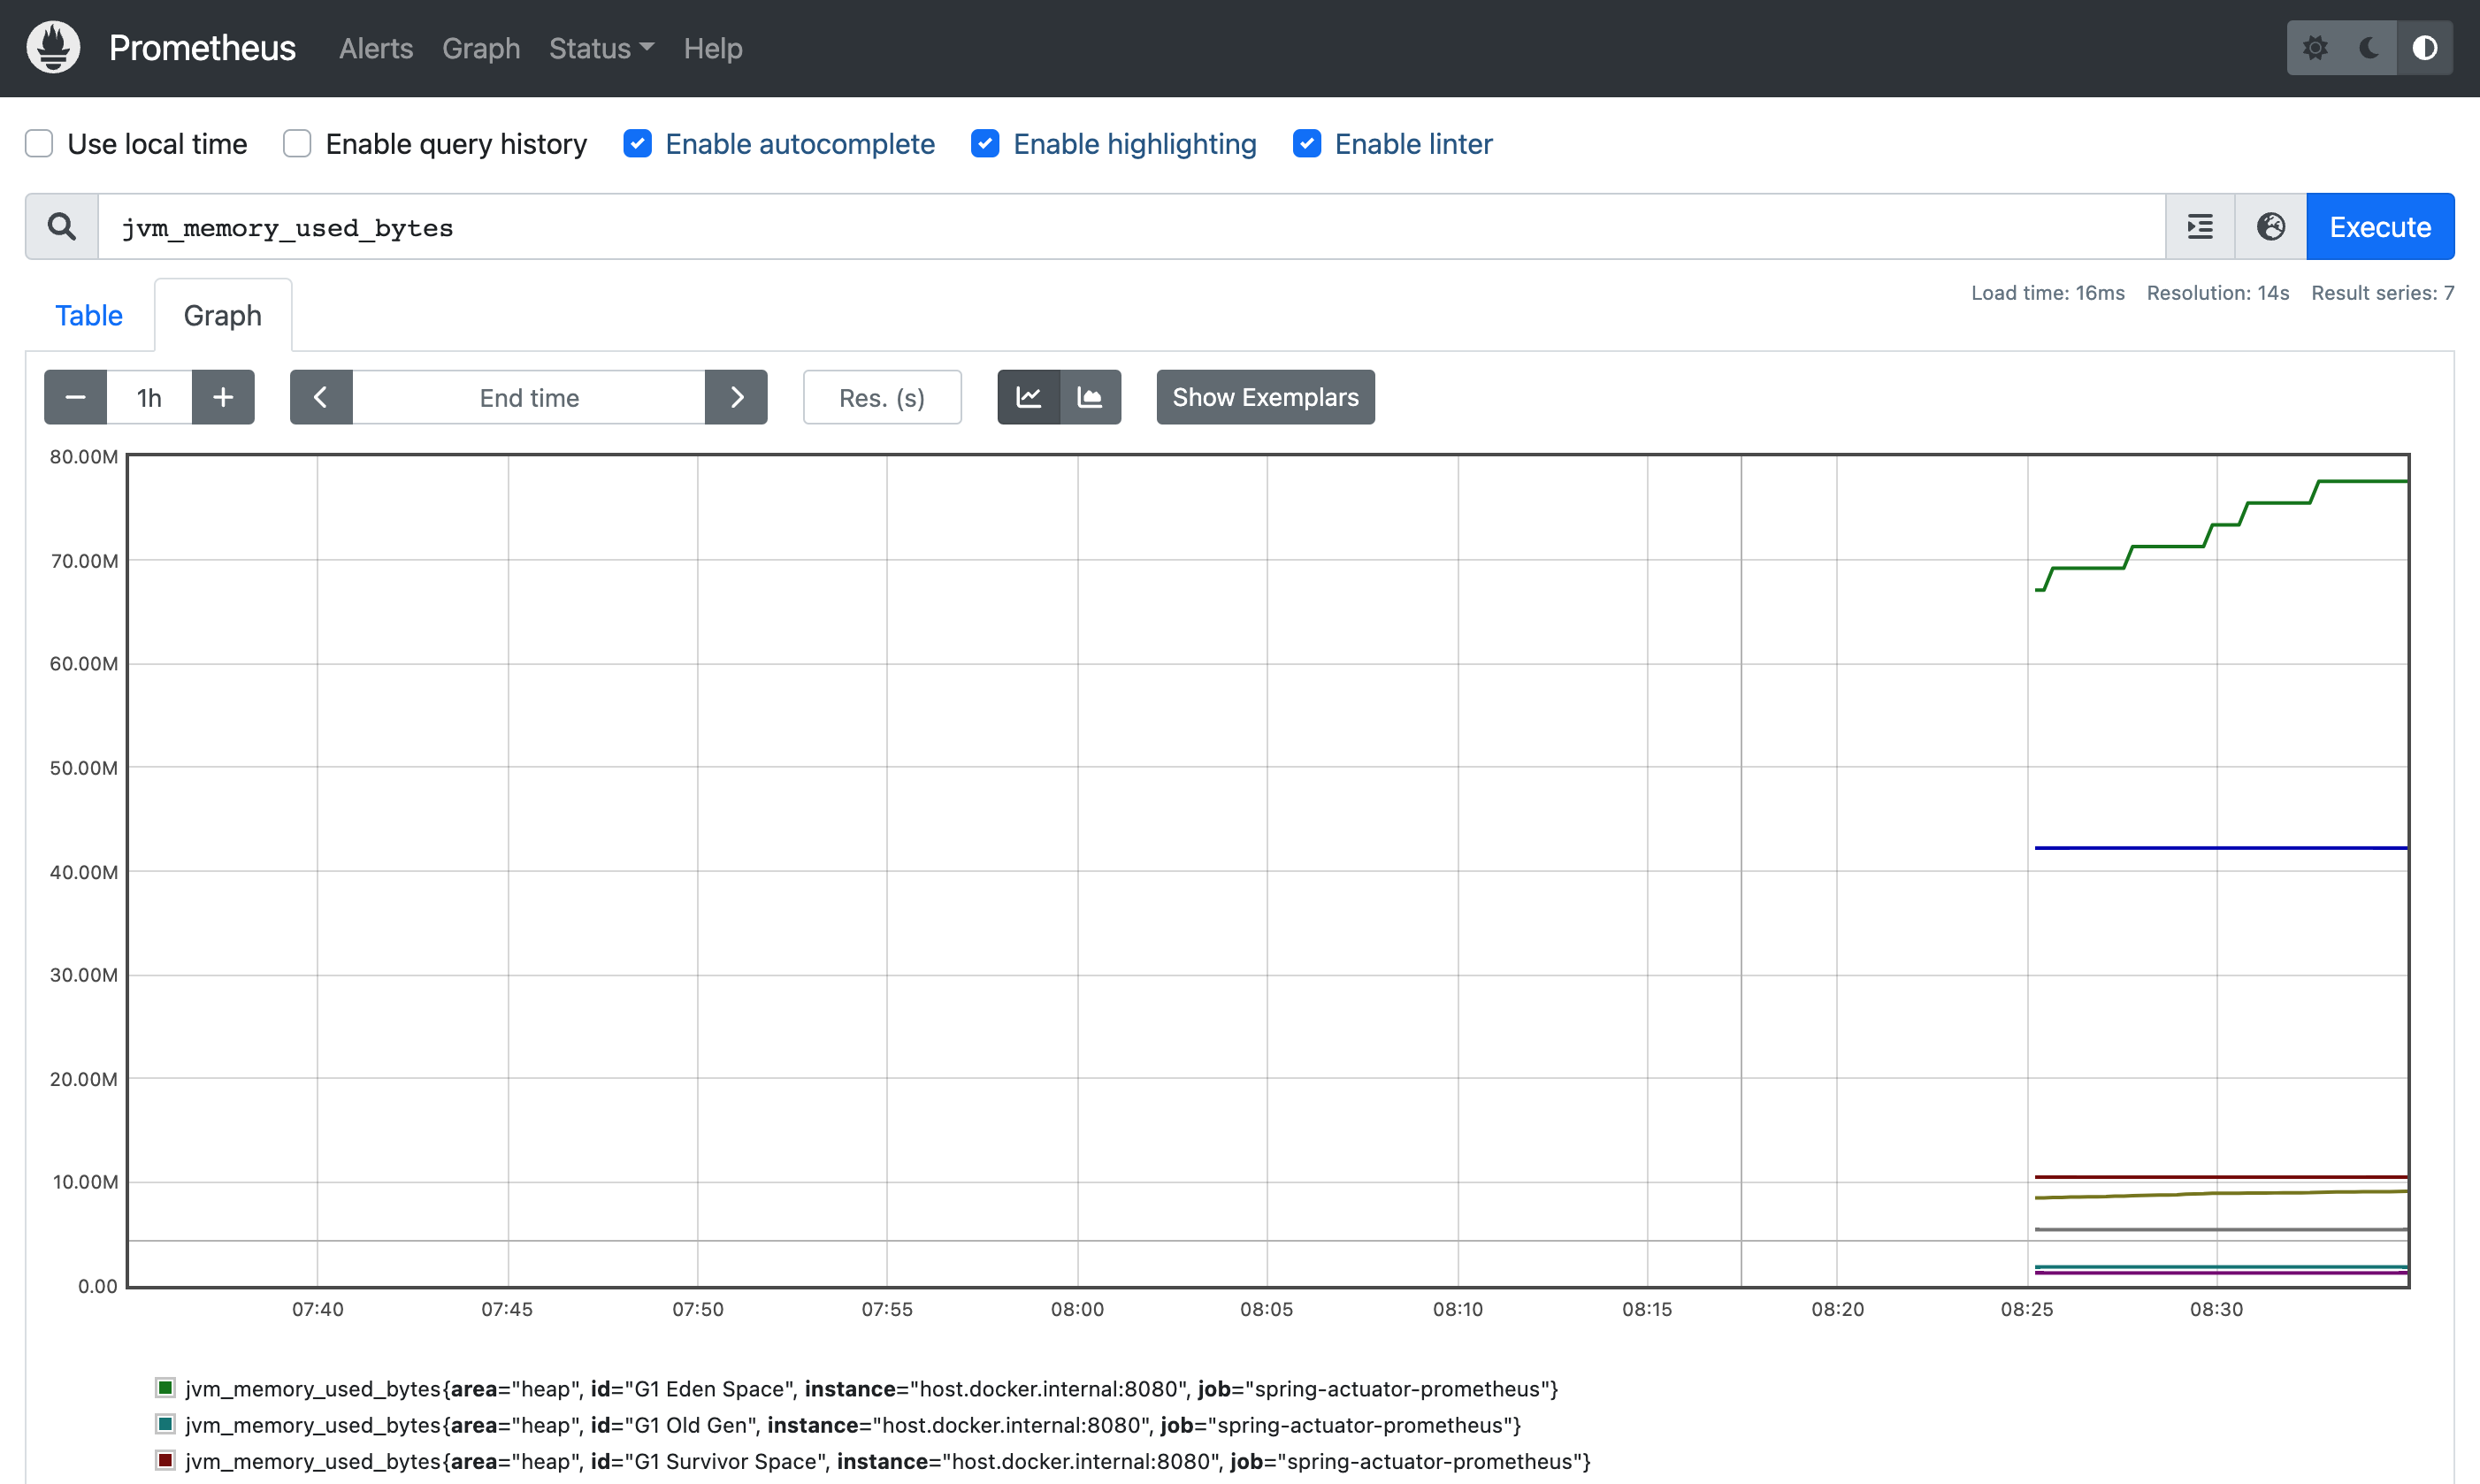
Finally, return to the main screen, enter jvm_memory_used_bytes in Expression, execute it, and select Graph to see a chart like the one below.
Grafana Server
Now let’s look at how to visualize the metrics collected by Prometheus in Grafana.
You can run queries on the Prometheus web page and visualize the desired metrics as graphs. However, manually running queries every time for monitoring is inefficient, and the built-in dashboard is limited to simple graph viewing.
Because Prometheus alone has limitations for visualization, metrics are usually monitored with a separate visualization tool.
If you followed this page, Grafana should also already be installed together with Prometheus.
Grafana login
First, open Grafana (http://localhost:9090) and you will see the Grafana login screen as shown below.
You can log in with the default account information (ID/password), admin/admin.

Add a Grafana data source
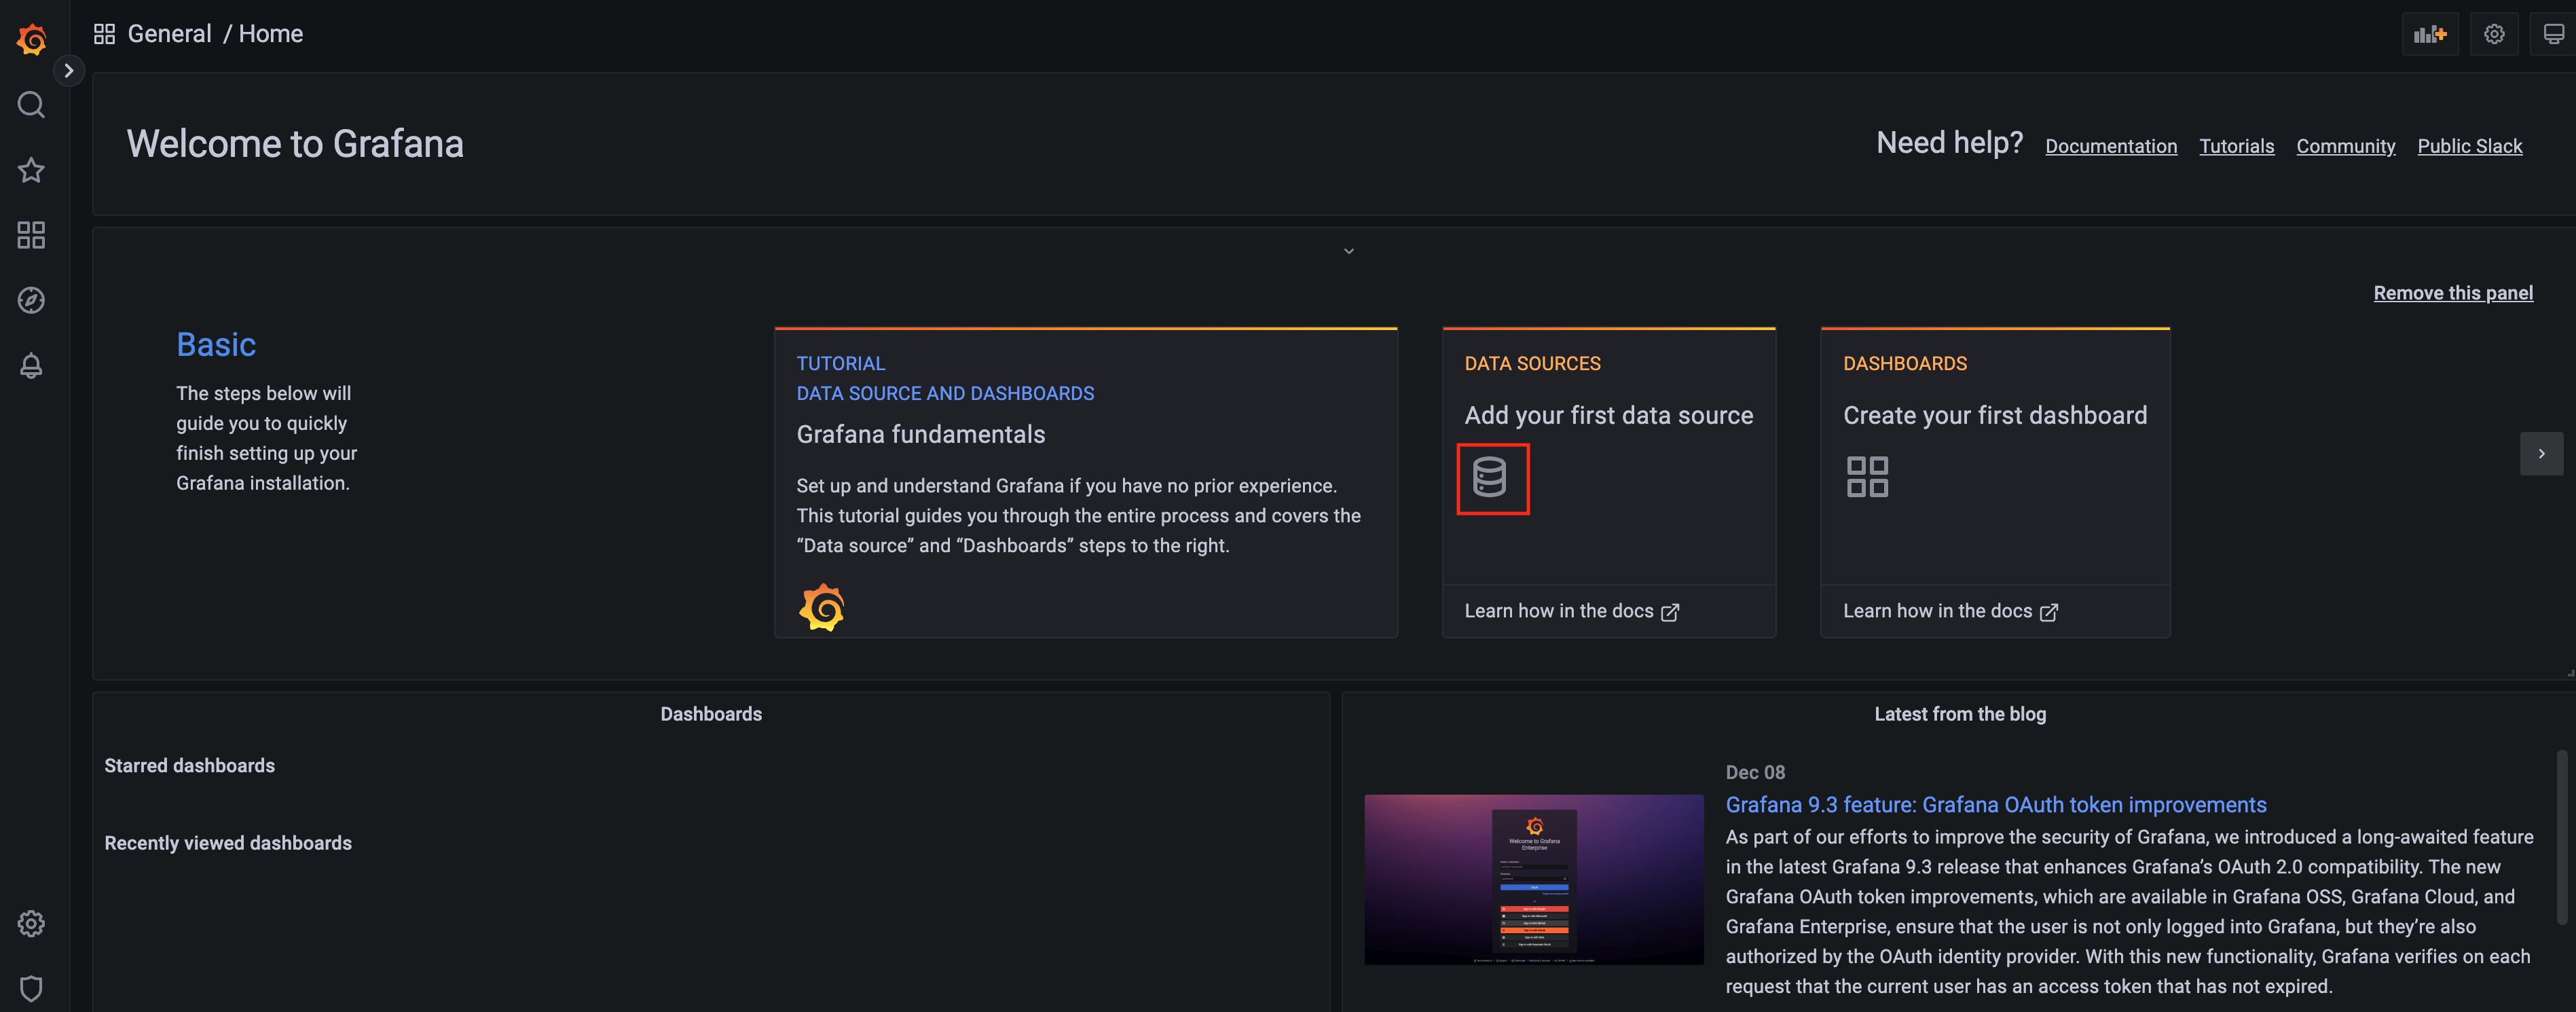
After logging in, the first screen below appears. Click the icon under DATA SOURCES.
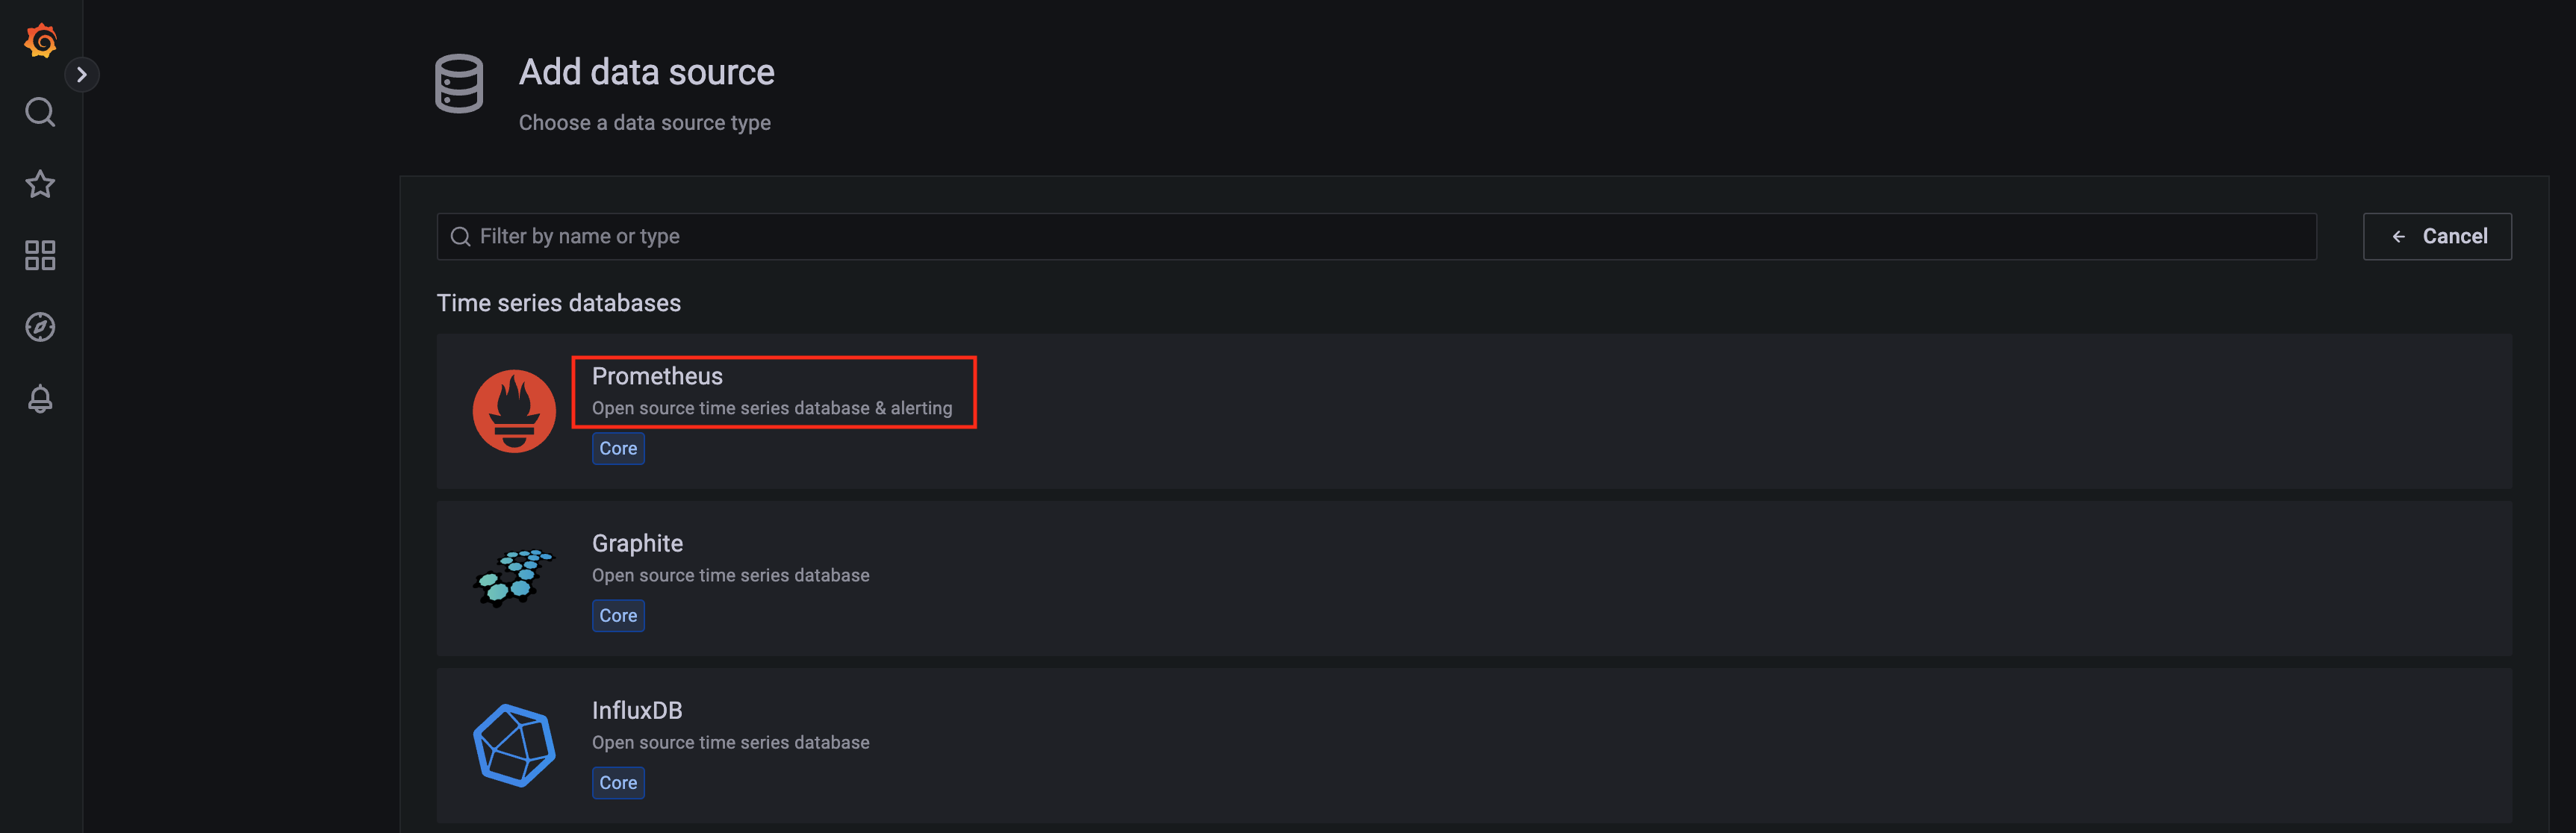
Click Prometheus in the list of data sources to add.
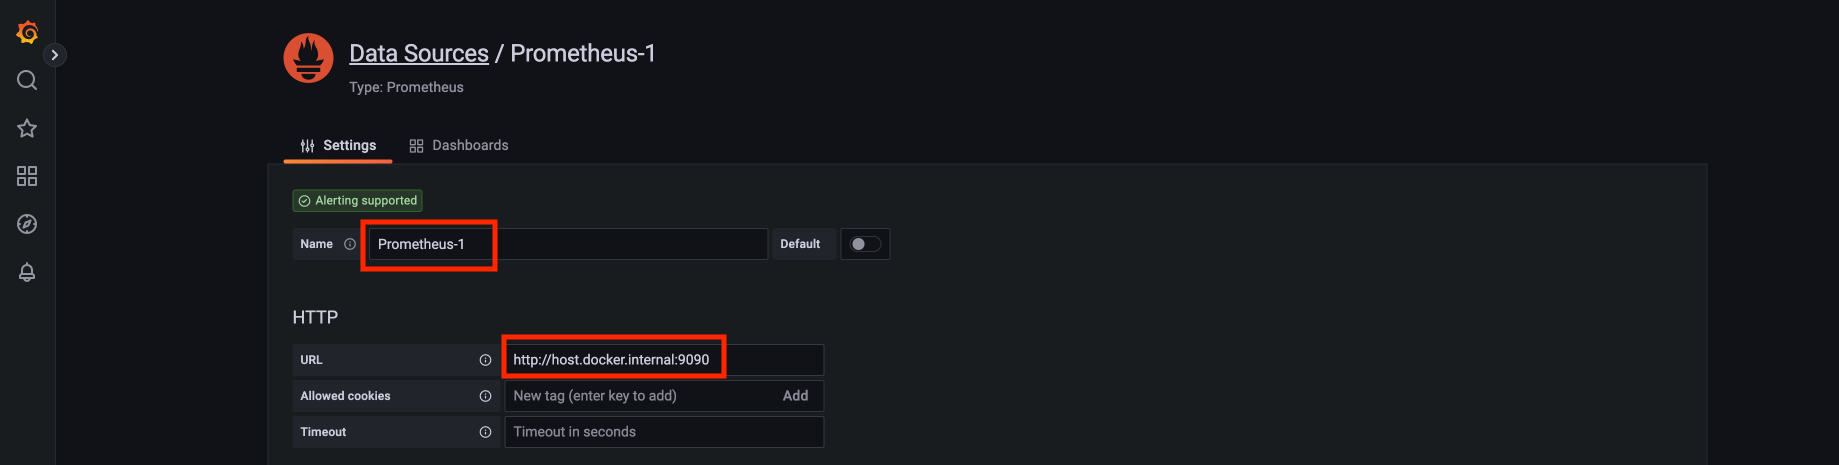
When the screen for adding a Prometheus data source appears, enter Name and URL.
For Name, enter any name you want, and for URL, enter http://host.docker.internal:9090.
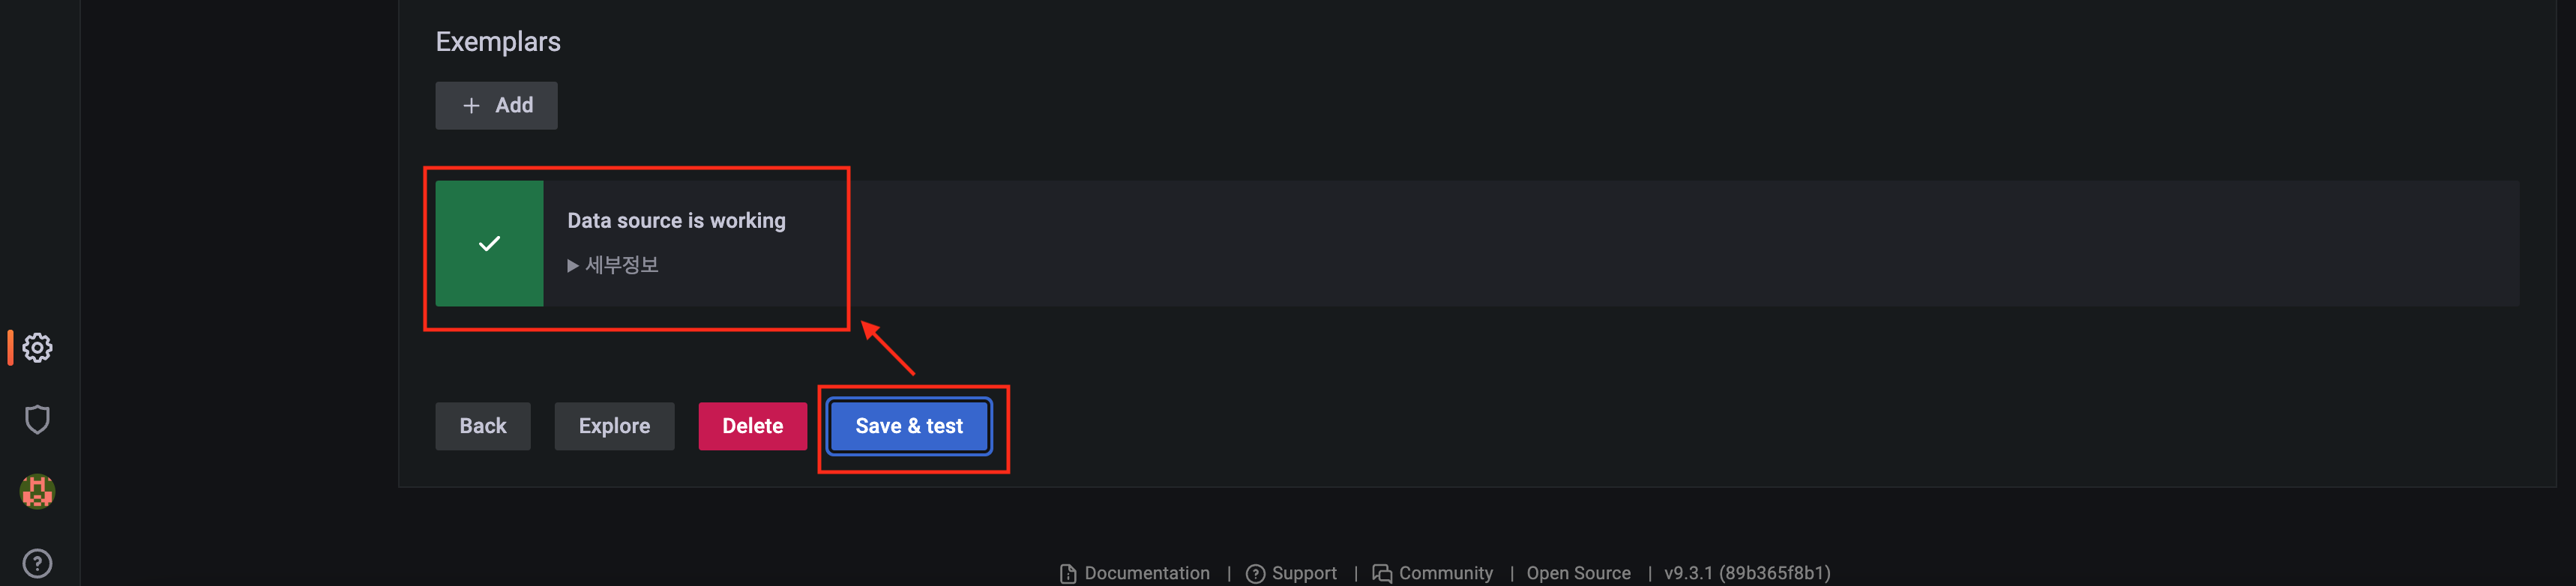
Scroll down and click the Save & test button. A success message, Data source is working, will be displayed.
Click the Configuration icon to confirm the data source you just registered.
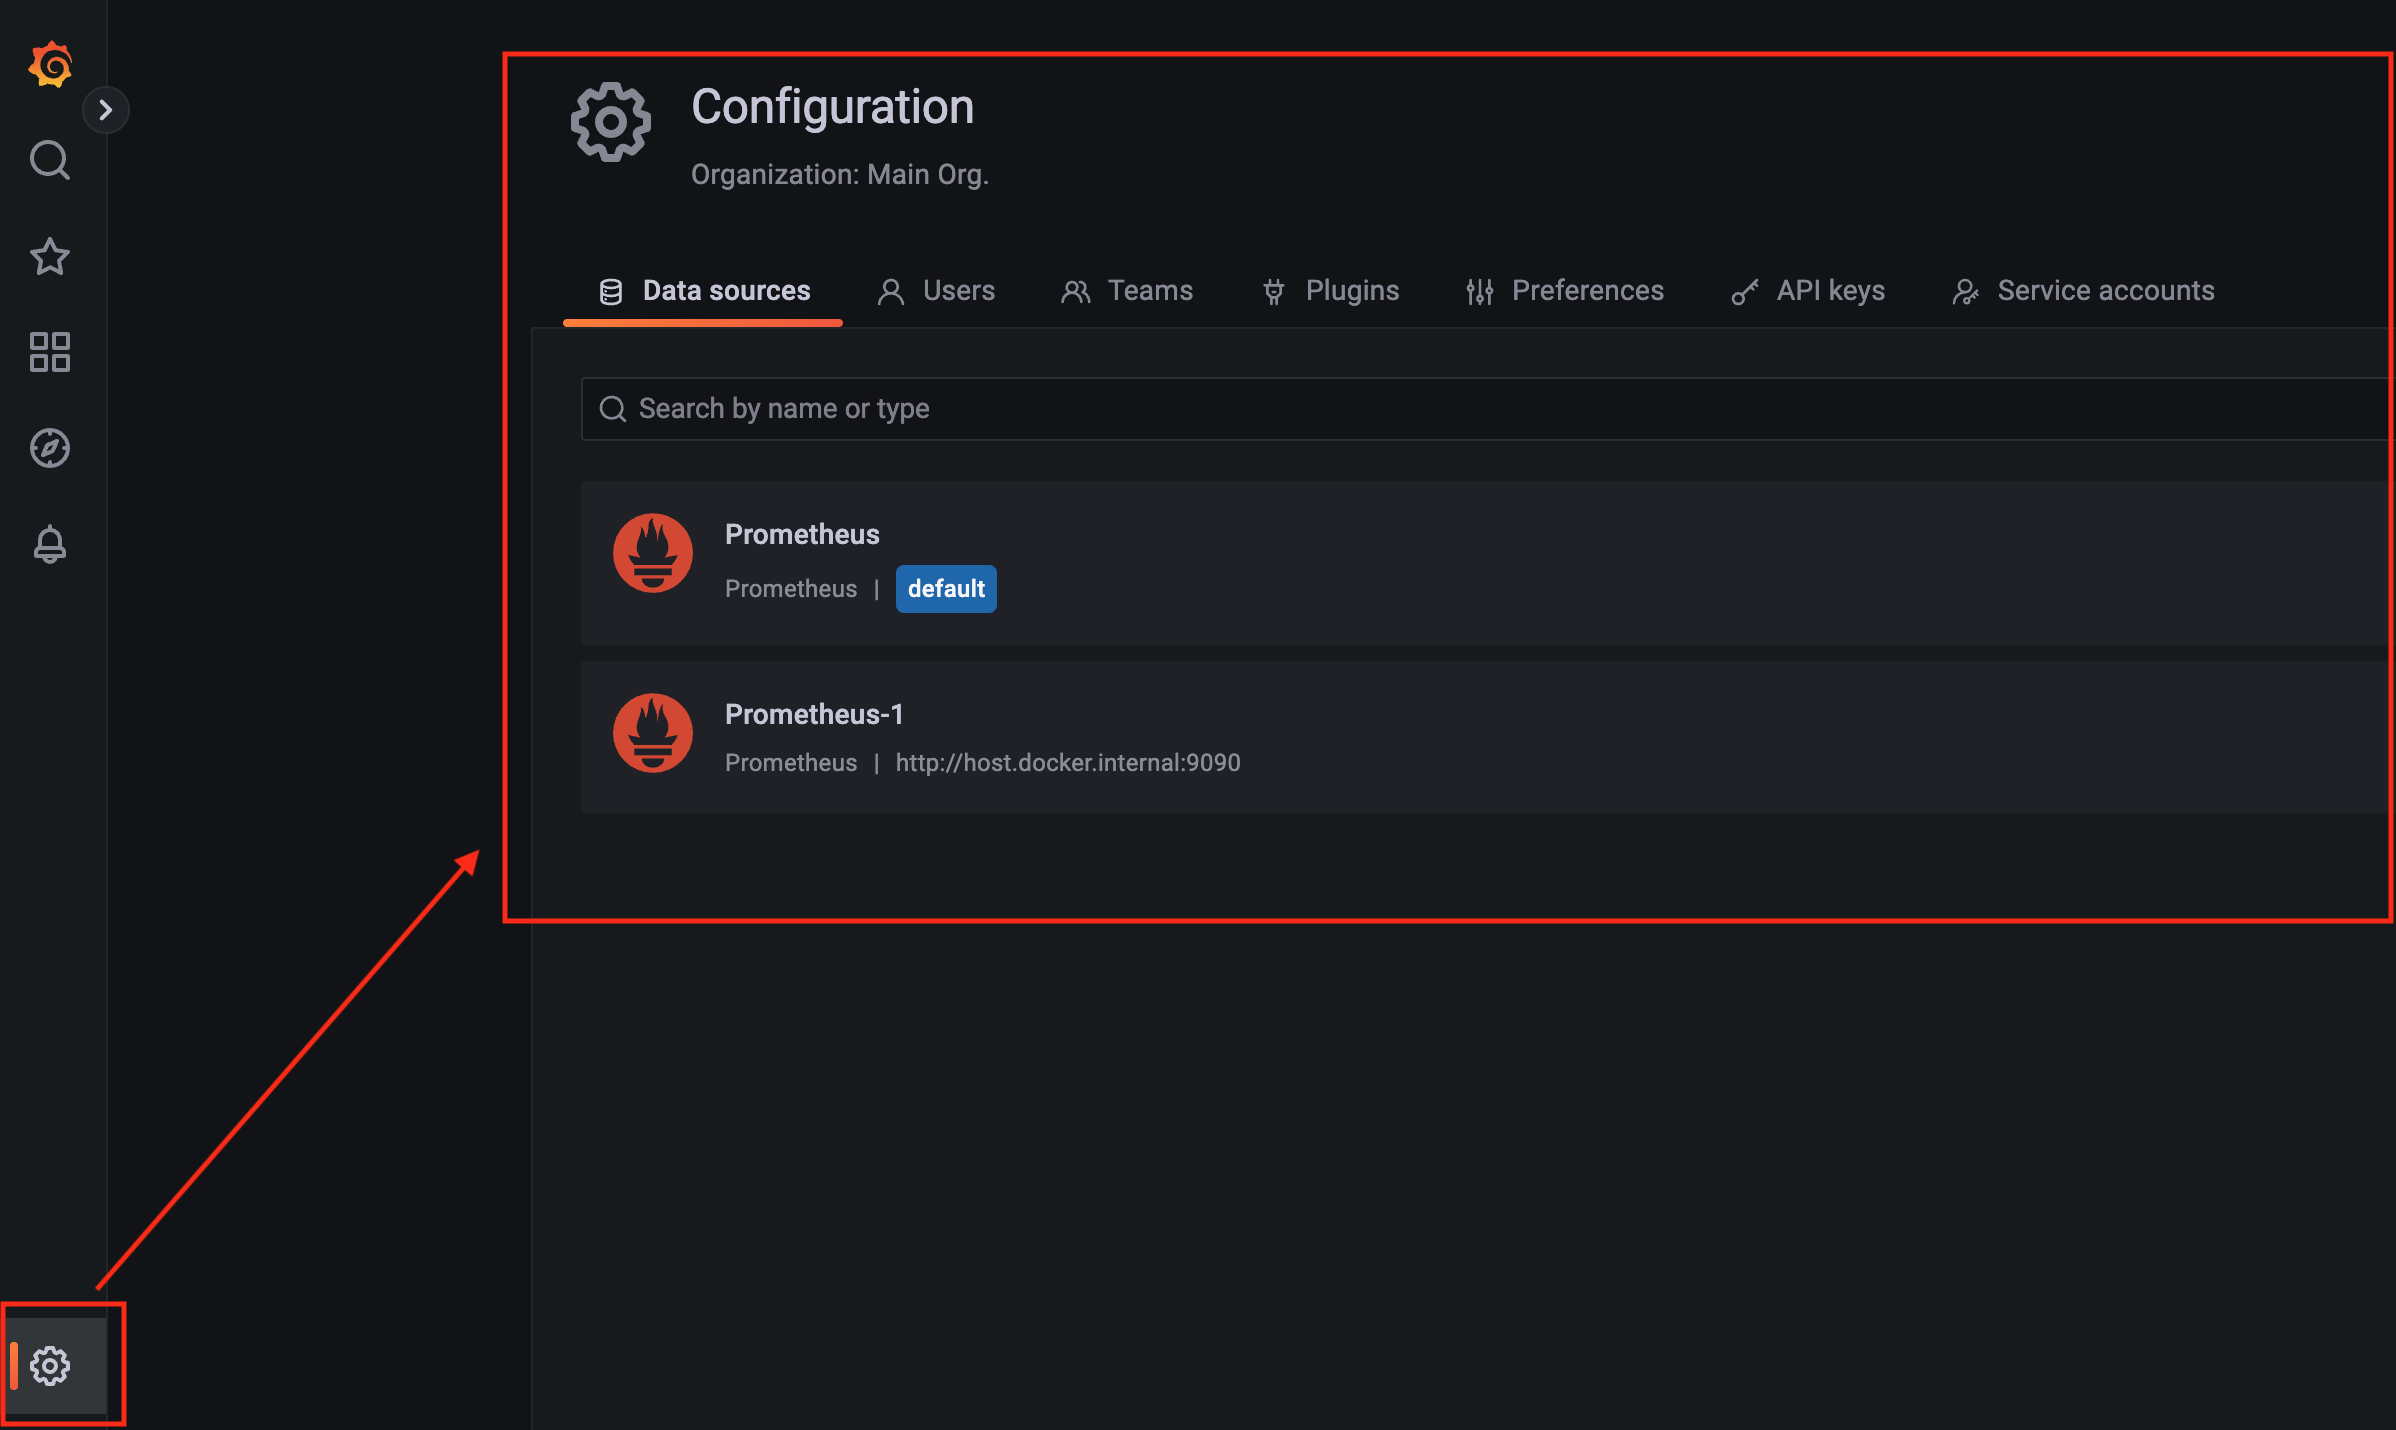
Add a Grafana metric graph chart
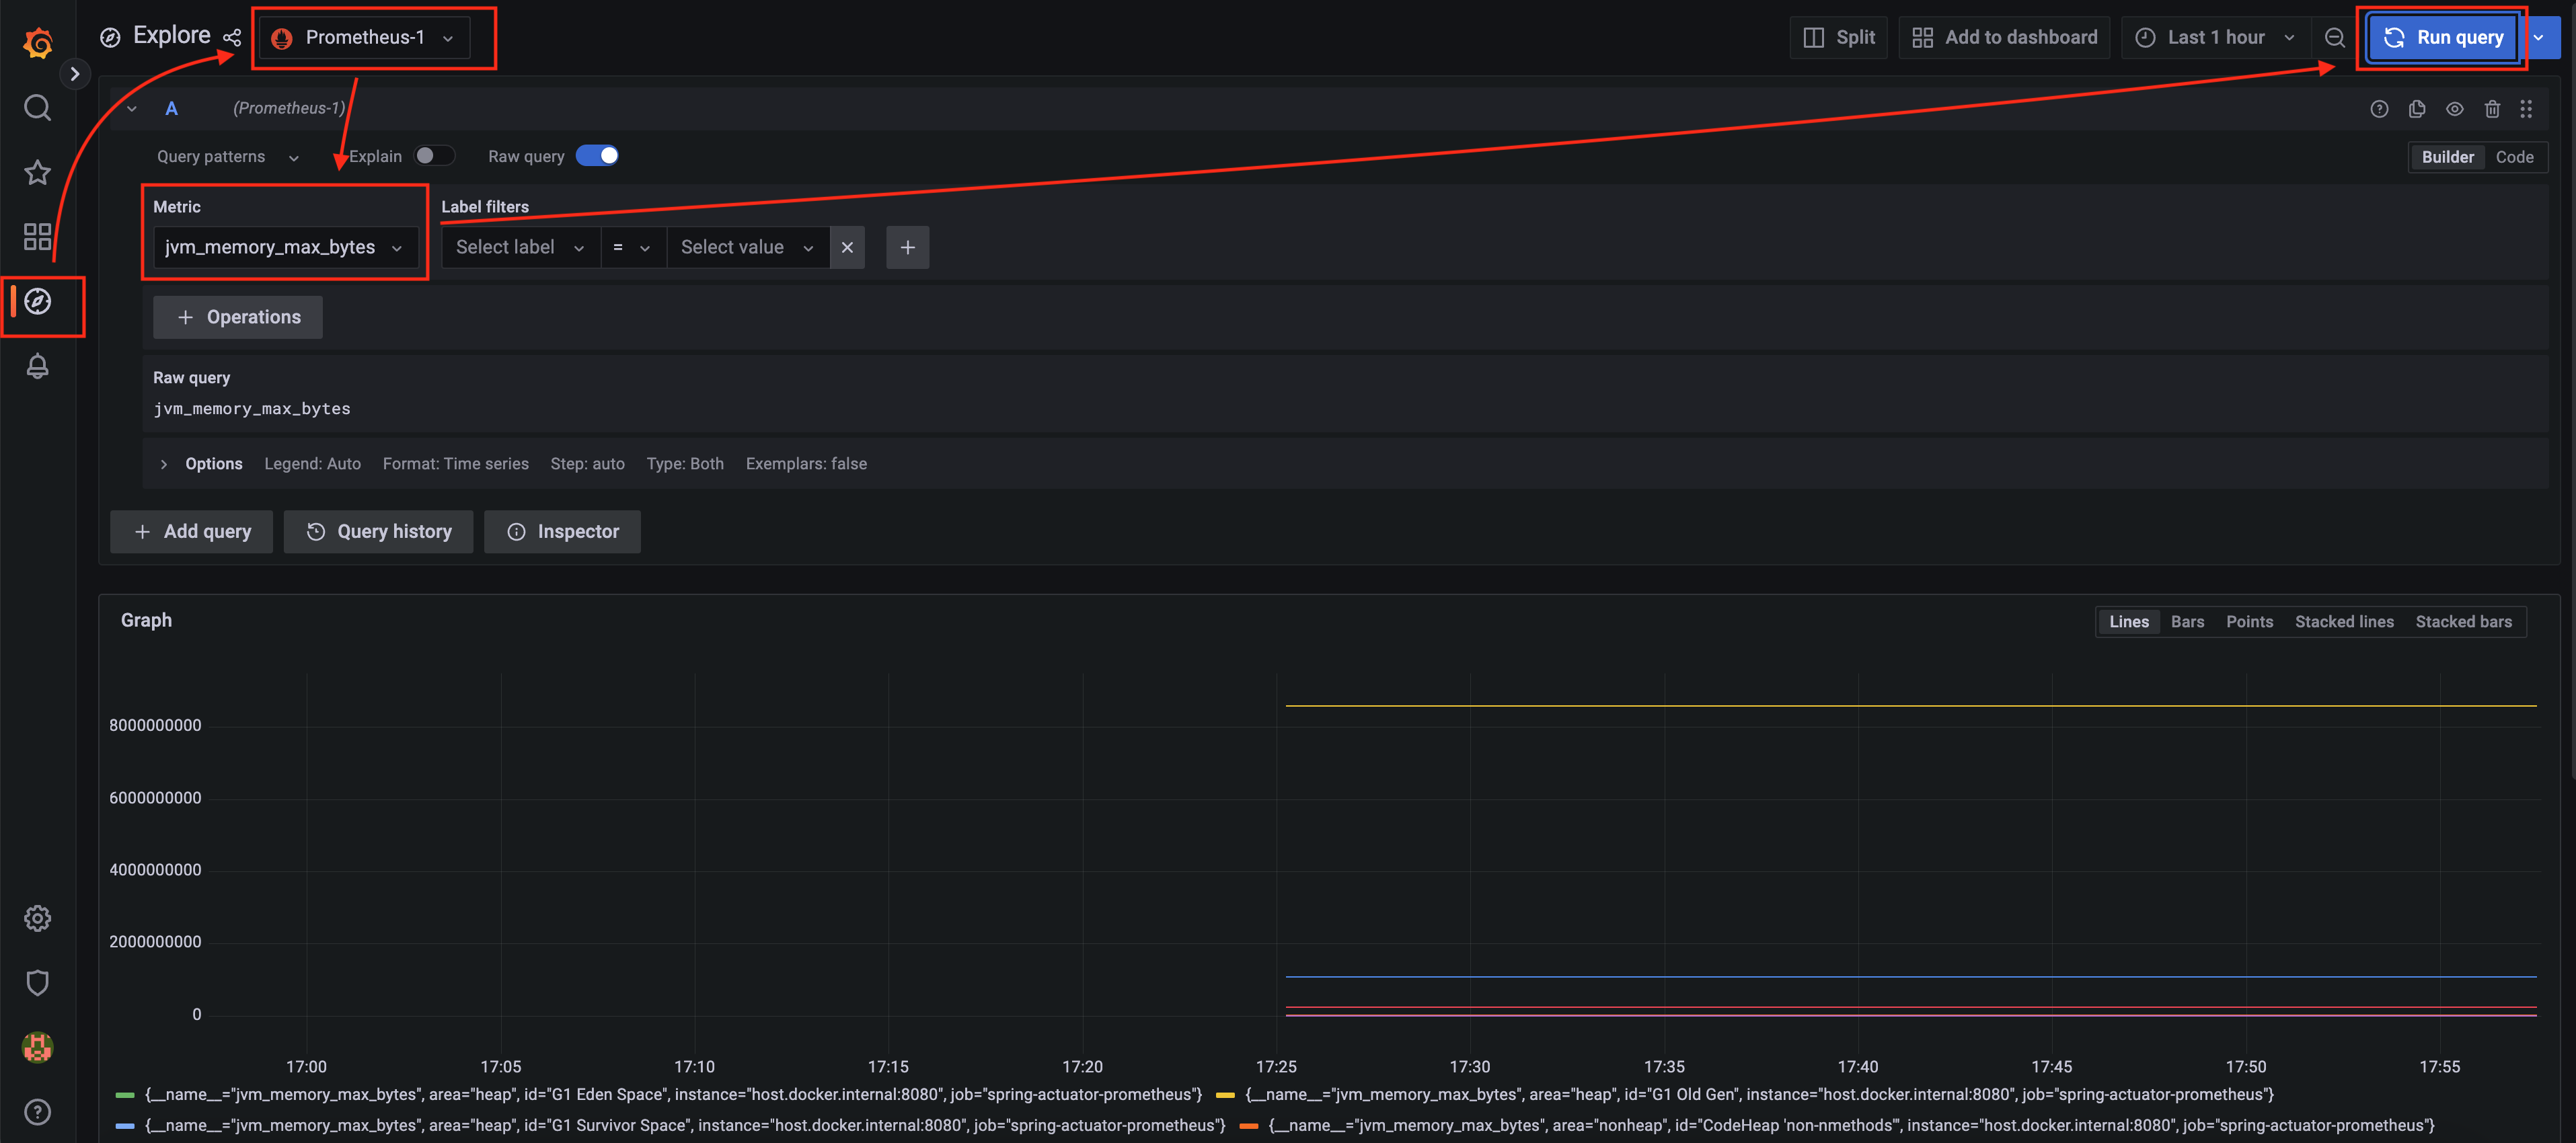
Next, click the Explore icon, select jvm_memory_max_bytes for Metric, and click the Run query button.
Then you will see a graph chart like the one below.
Click the Add to dashboard button, and the Add panel to dashboard screen appears.
Select New dashboard, then click the Open dashboard button.

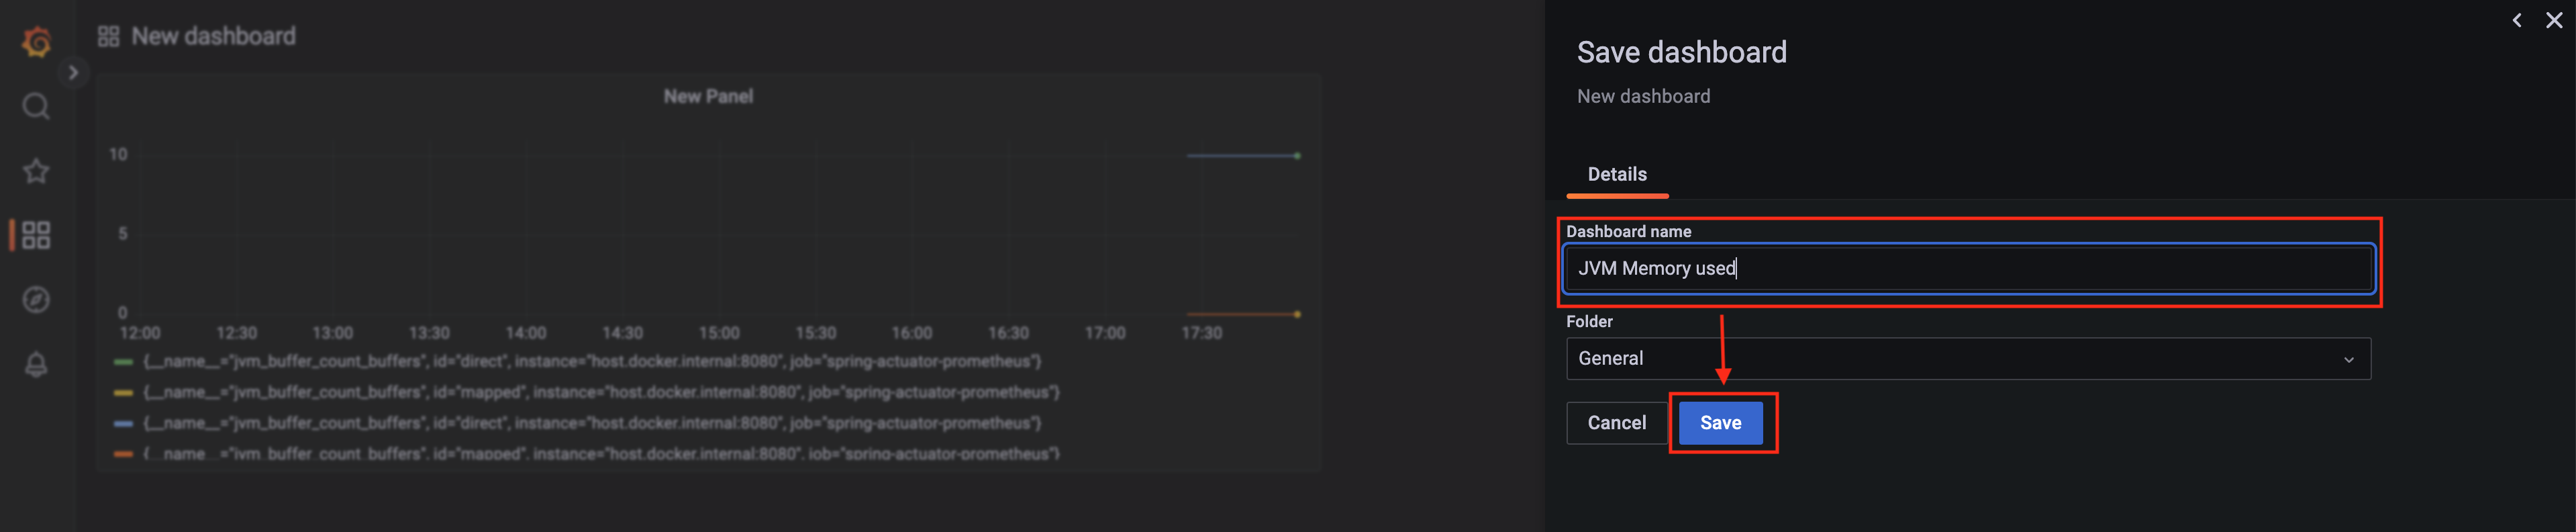
On the Save dashboard screen, enter a Dashboard name and click Save to save it.
Now click the Dashboard icon on the left and select the JVM Memory used item with the name you entered earlier.
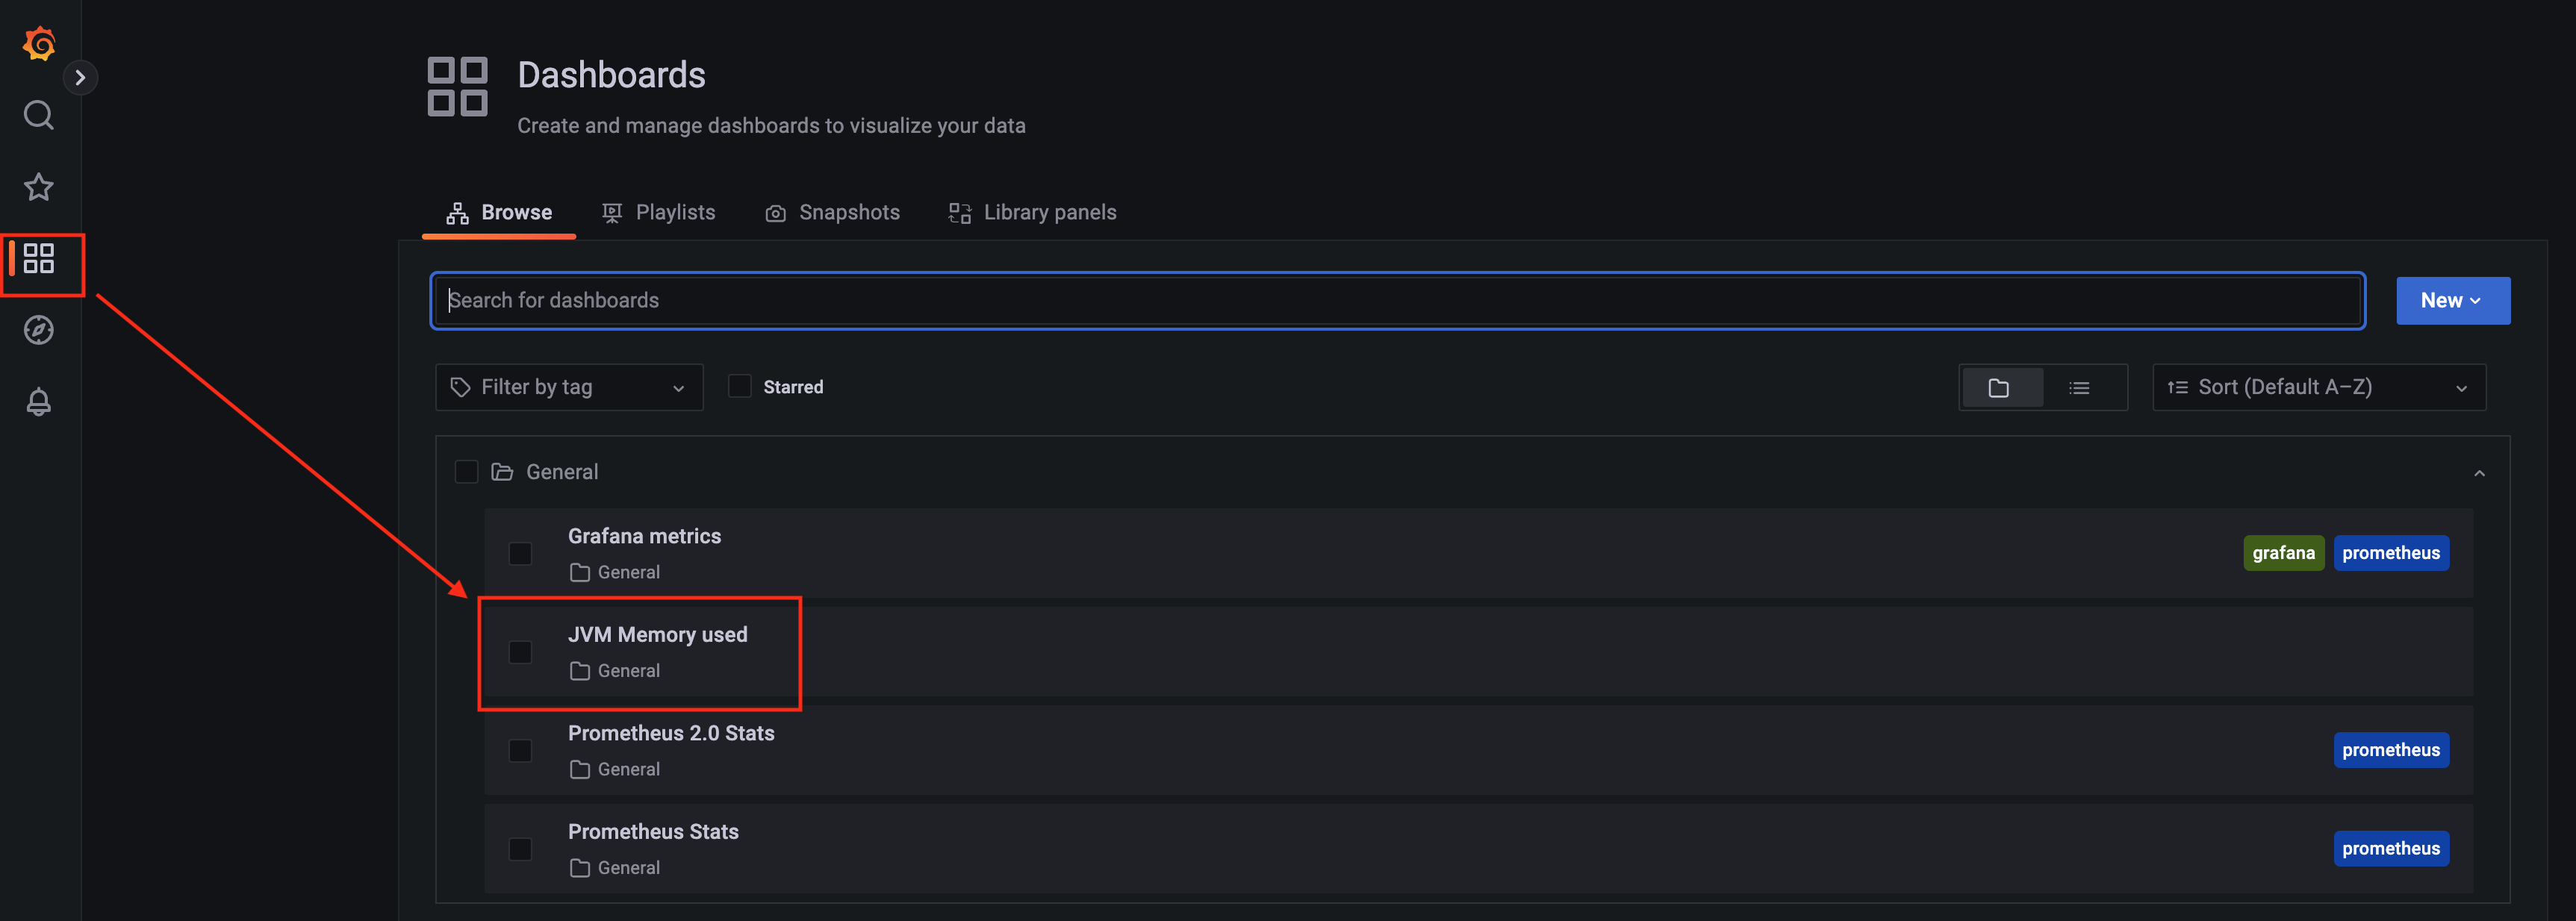
Then you can see the chart as shown below.
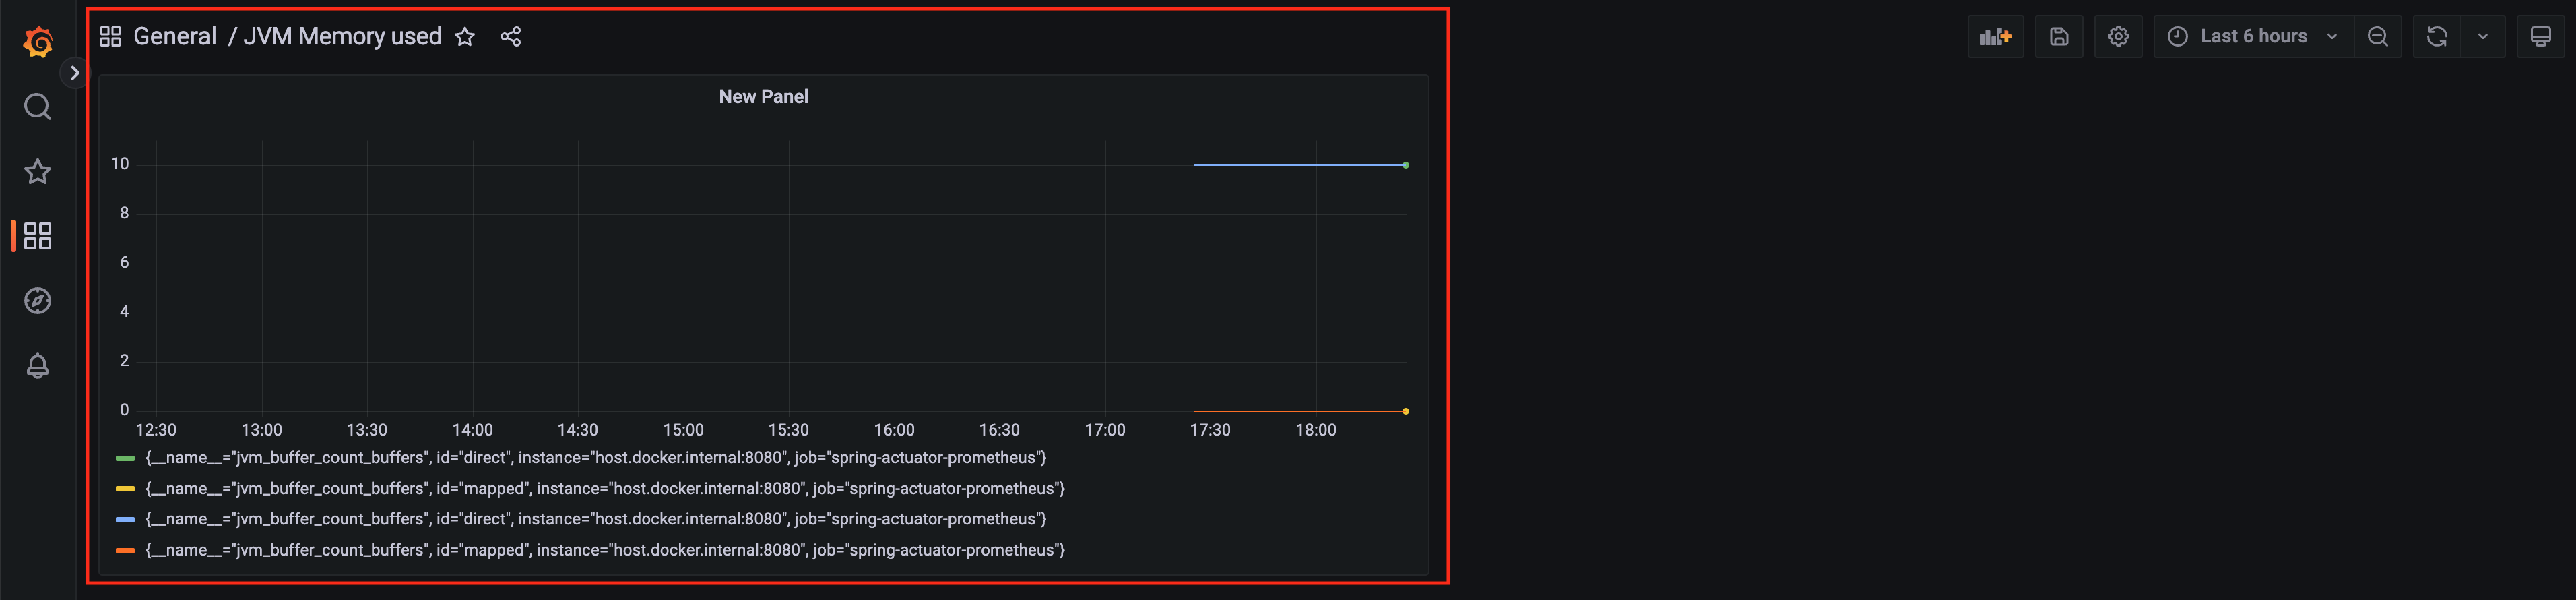
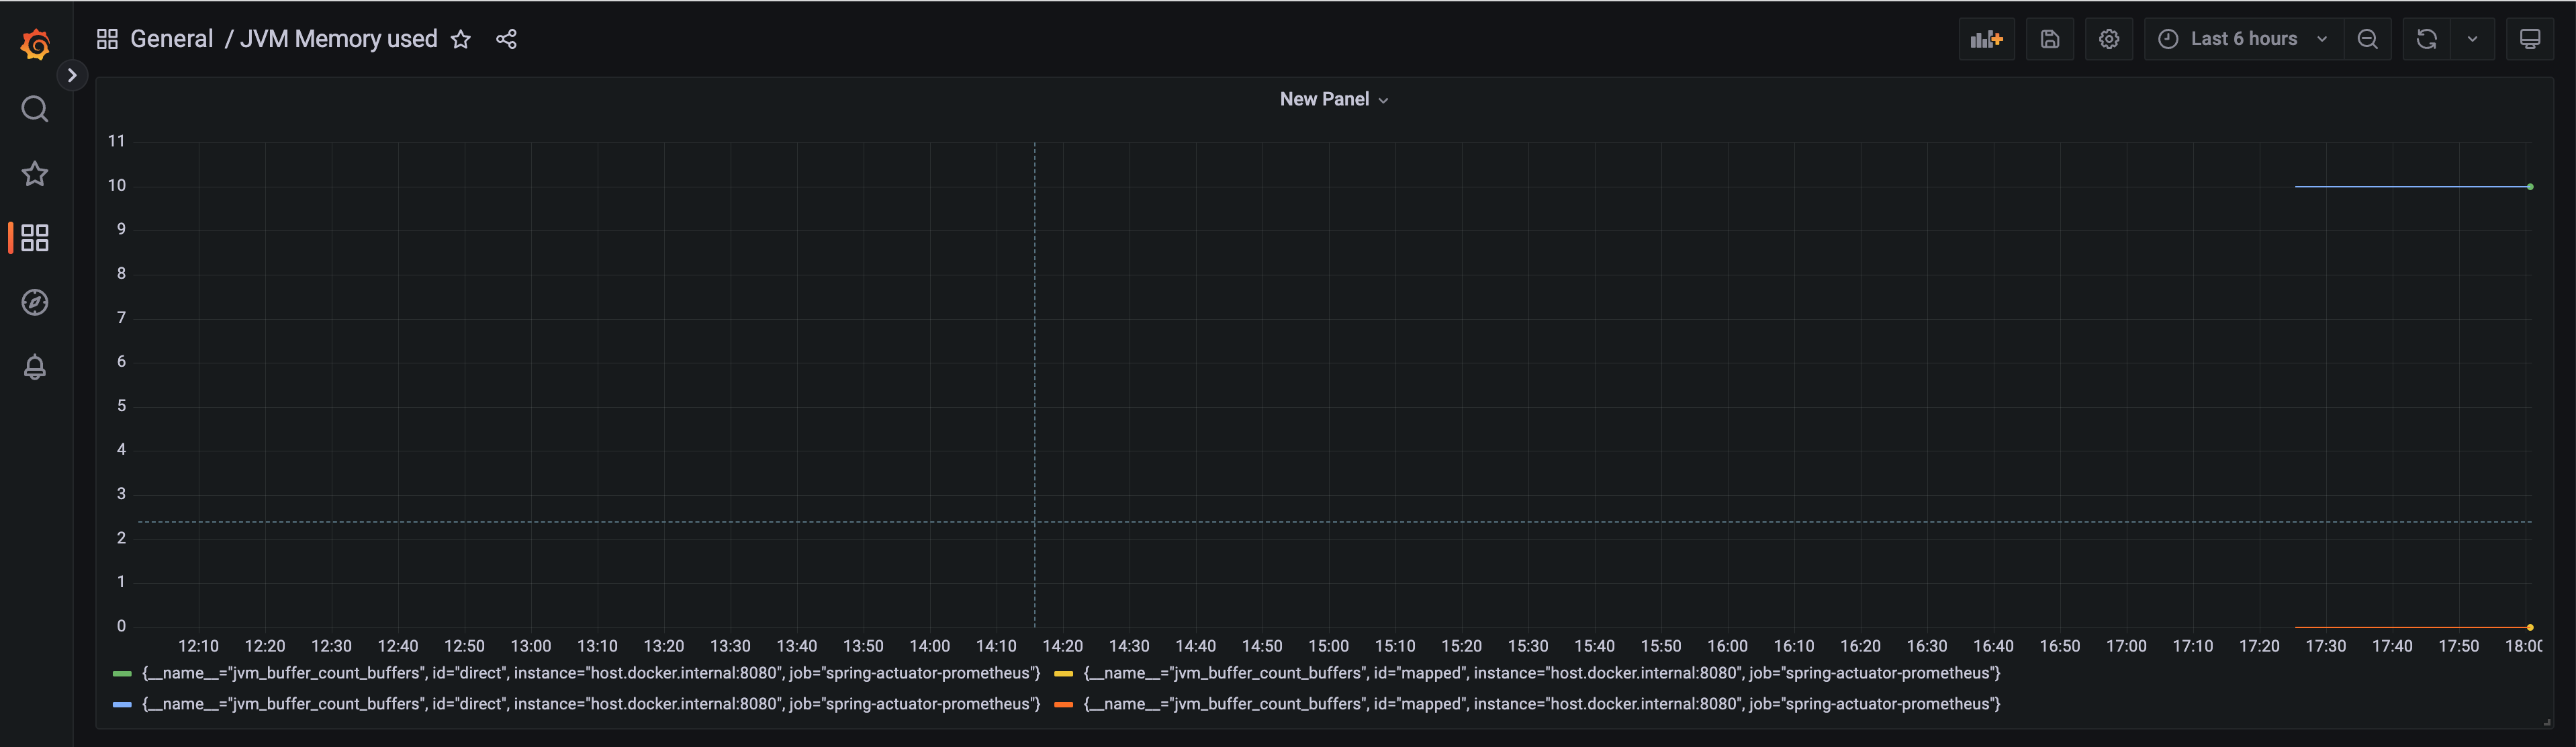
You can drag this chart sideways to resize it and save the layout.
References
- The complete project code is available here.
- Micrometer Application Monitoring | concepts
- Building a monitoring system for a Spring Boot application