Prometheus Features and Architecture
What is Prometheus?
Prometheus is a monitoring system developed by engineers at the overseas music-related service SoundCloud. Originally, Google had an internal system called Borg, which was the predecessor of Kubernetes, and Google created software called Borgmon to monitor it. Prometheus is an open source system modeled after Borgmon.
Prometheus has a pull-based data model that uses a time series database, and it automatically monitors targets through a feature called Service Discovery. It also has a dedicated query language called PromQL, which can be used to execute simple and flexible queries. In addition, many Exporters are available. These are monitoring agents, and by using them you can monitor not only servers but also specific software, services, and many other targets.
What Makes Prometheus Impressive?
There are many things to say about what makes Prometheus impressive. First, look at the following example. It is quoted from a presentation at the overseas conference PromCon 2016.
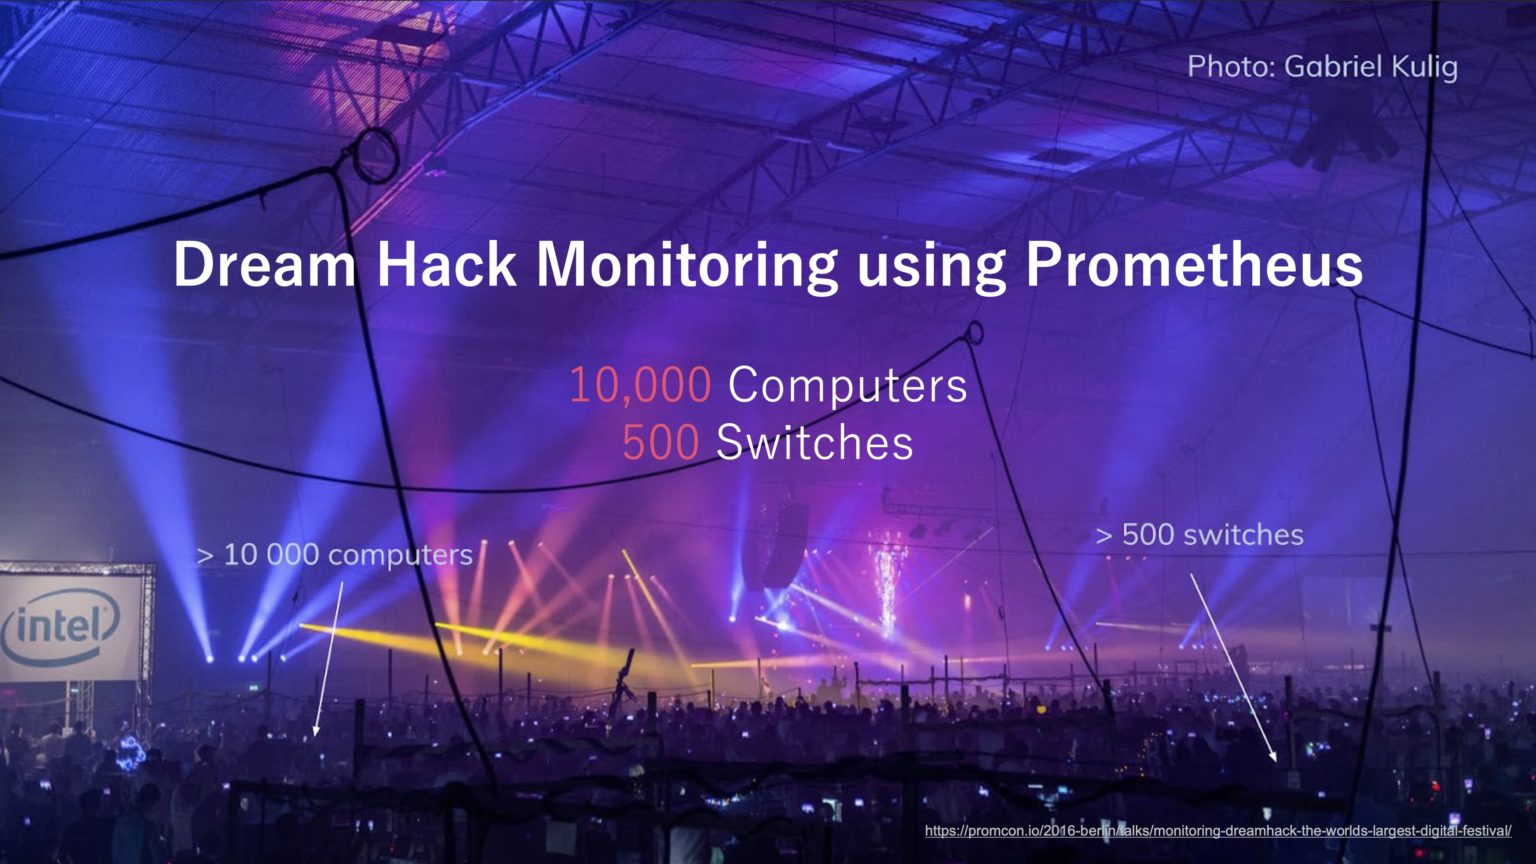 Prometheus was used for DreamHack system monitoring (source)
According to this, Prometheus was used to monitor the background systems for DreamHack, a gaming-related event. At that time, it became well known for monitoring 10,000 computers and 500 switches. This happened in 2016, and Prometheus was already able to monitor this many computers at the time. It has been updated since then, so it is reasonable to expect even higher performance today.
Prometheus Architecture
The Prometheus documentation shows the following diagram for Prometheus architecture.
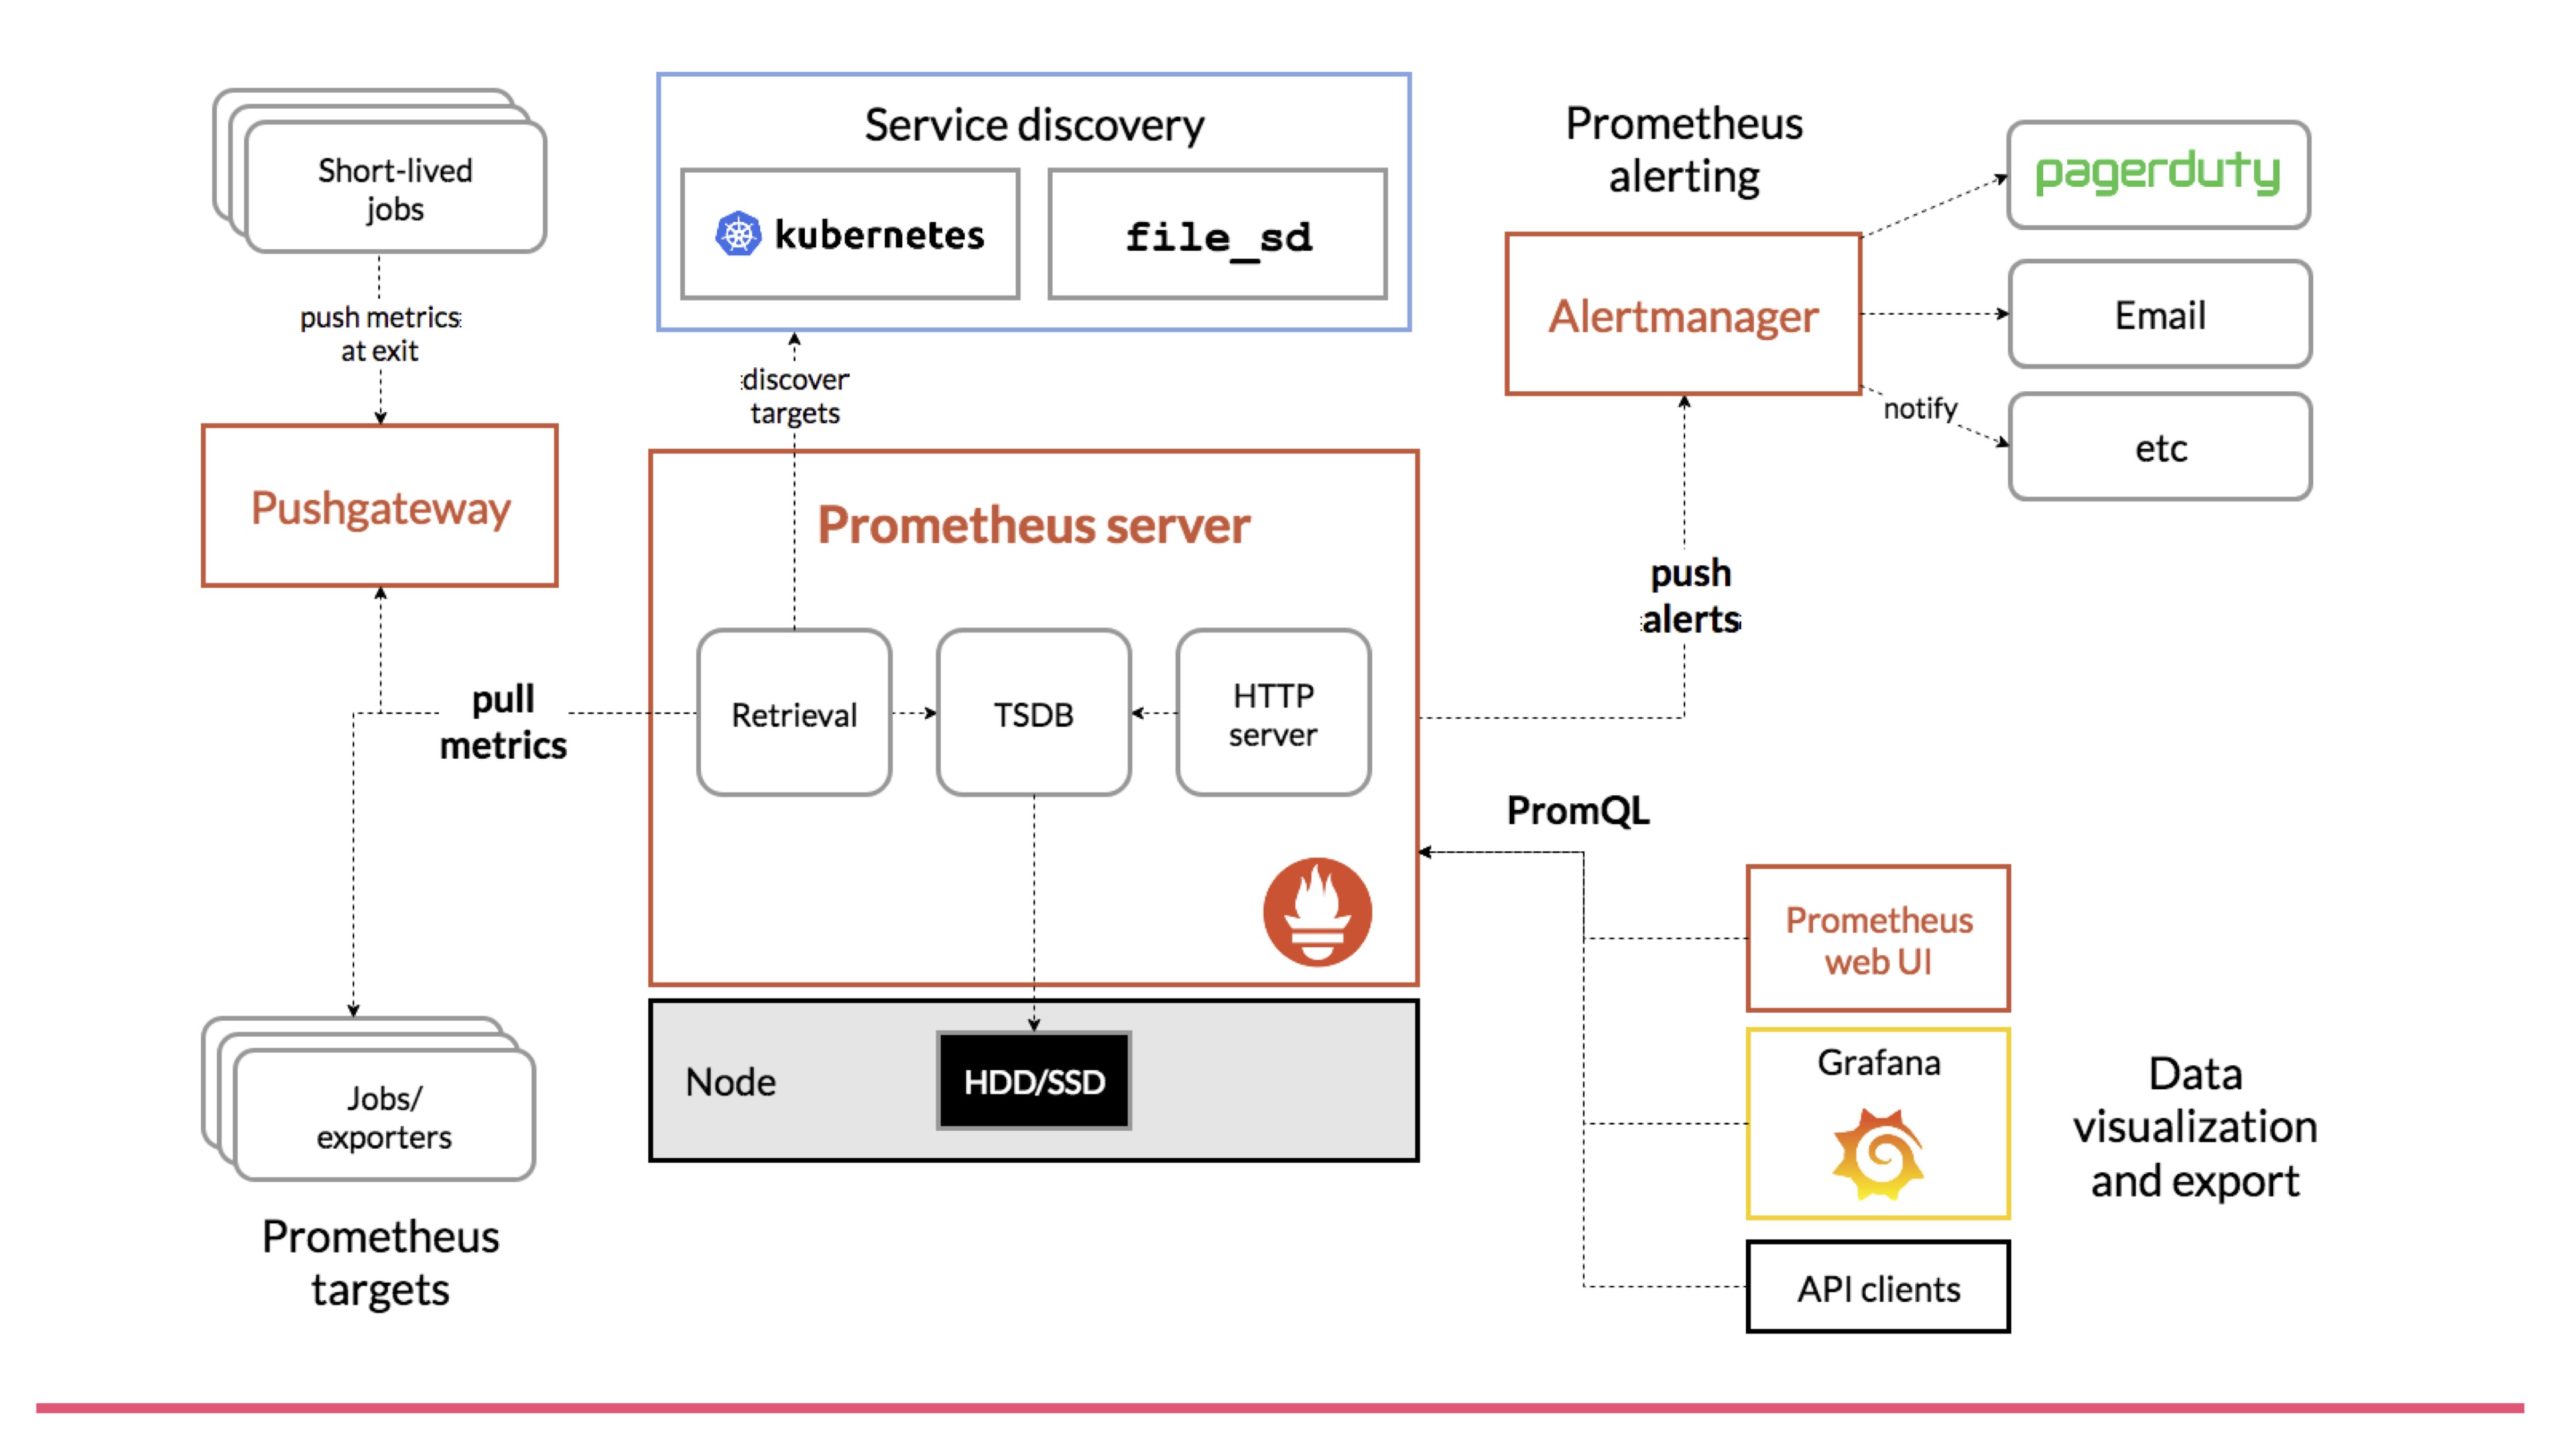 Prometheus architecture
This diagram can be divided into six major parts.
- Prometheus Server, the main Prometheus component
- Service Discovery
- Monitoring agents called Exporters
- Alerting, which handles alert functionality
- PromQL, the query language
- Visualization
Let’s explain each of these.
Prometheus Server
As mentioned earlier, Prometheus Server is the main Prometheus component. Prometheus Server itself is responsible for collecting Metrics from each monitoring target, running queries against collected Metrics to reference Metrics information, and automatically running queries internally on a regular basis to manage alerts.
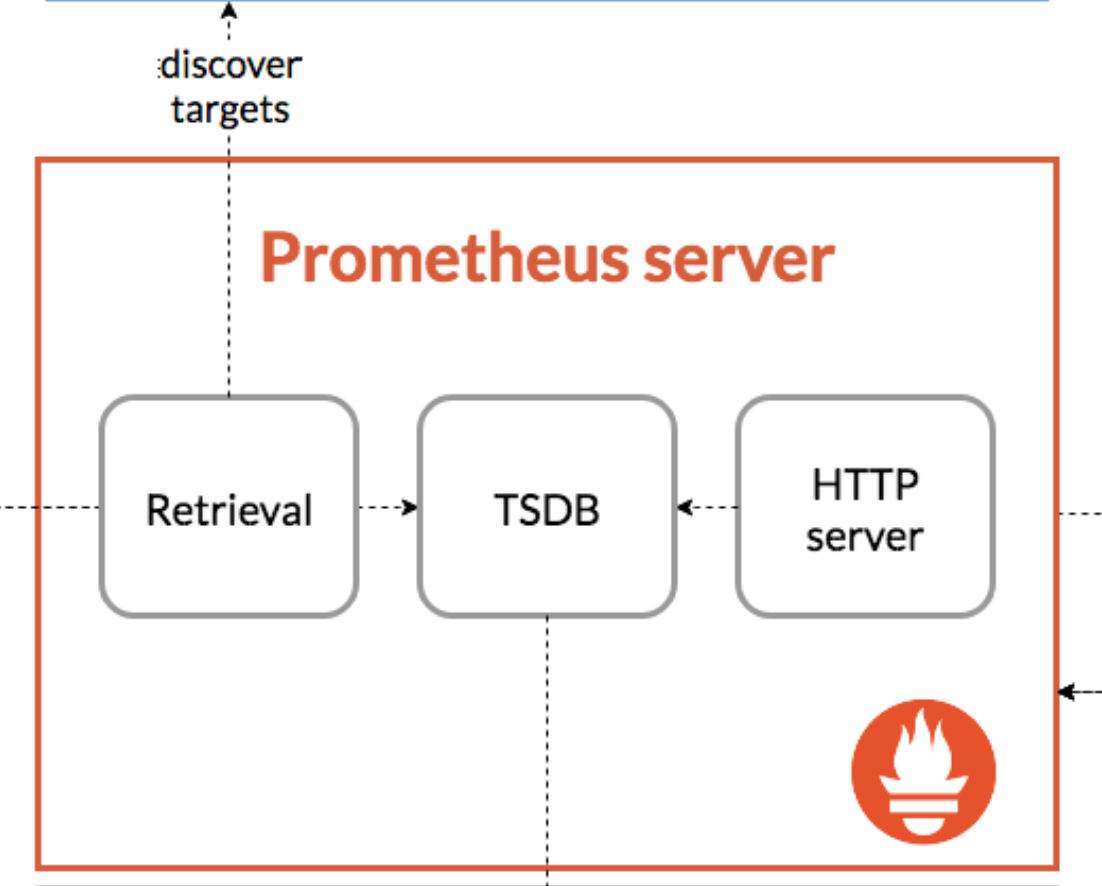
Also, starting with Prometheus Server, much of the software included in the Prometheus ecosystem runs as a single binary. In other words, it can run just by downloading one binary. For example, to use Zabbix, you first need to install the Zabbix server, and in addition you need to prepare MySQL and configure related settings, which can be unexpectedly cumbersome. Prometheus Server is characterized by being able to run simply by executing one binary.
Service Discovery
Service Discovery is a mechanism for automatically obtaining monitored information. By using it, Prometheus periodically calls the API of a cloud platform or specific software and collects information about registered instances.
For example, suppose a cloud service has three servers, and their names and IP addresses are obtained through an API and passed to Prometheus as target information. Later, the service needs to scale, so three more servers are added. Now there are six servers. Because the fact that these three servers were added can also be detected through periodic API calls, they are added automatically. If the overload ends and three servers are deleted, the number returns to three. In this case as well, Prometheus can obtain the information that three servers were reduced through periodic API calls, so it automatically reduces the targets to three. This mechanism automates the tedious work of registering targets one by one manually or registering them in a dedicated file.
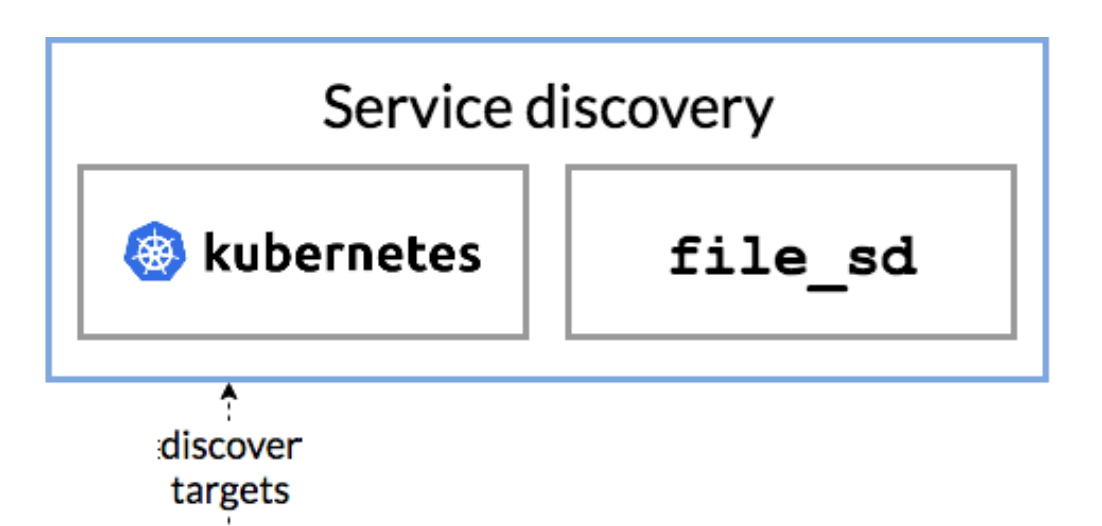
What makes this useful is that when using modern cloud services or microservice systems, information about each instance changes very frequently. Today, containers such as Docker and Kubernetes have become common. Containers may run for a long time, but they are also assumed to be created, disappear, and be created again repeatedly. Service Discovery makes it easier to handle these cases.
Service Discovery supports Azure, AWS EC2, GCP GCE, OpenStack, and of course Kubernetes. In addition, information can also be obtained from other platforms through extensions.
Exporter
Exporter is a monitoring agent. Exporters collect Metrics from monitoring targets and expose them to Prometheus. For example, it is possible to obtain information such as Nginx CPU usage or how many requests are arriving, but Prometheus does not know each format. Maintaining all of those formats on the Prometheus side every time would be difficult. Therefore, an Exporter is placed between them. The Exporter can obtain Metrics information from target systems such as Nginx or Apache. The retrieval method may be an API, direct execution of a specific command, or other methods. The Exporter converts the collected Metrics information into a form that Prometheus can read.
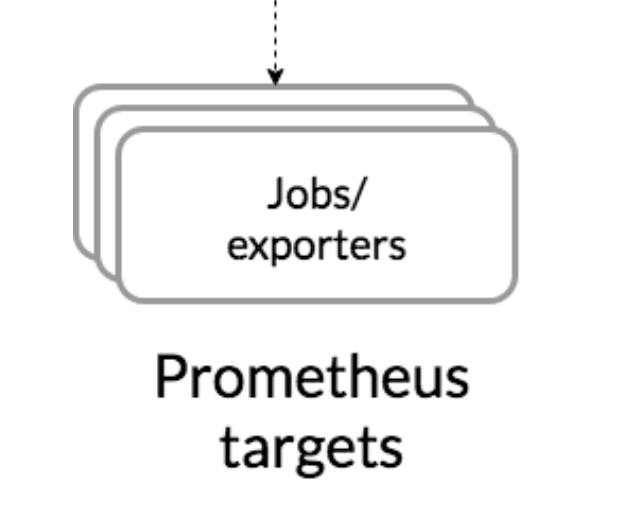
There are currently more than 600 Exporters. You can also create custom Exporters, so monitoring that was not possible with other systems can be done easily.
Alerting
In other monitoring systems, it may seem natural that an alert mechanism should be provided by default. Unfortunately, Prometheus itself does not have alert functionality. Therefore, a component called AlertManager is used. This is one of the pieces of software maintained by the Prometheus community, and AlertManager is very useful. For example, when multiple Prometheus instances are deployed and alert handling is done by one AlertManager, duplicates are automatically removed. It can merge alerts by determining that two alerts are the same, group several similar alerts into a form such as “this kind of failure occurred,” and route alerts by looking at Prometheus Metrics labels, such as assigning one alert to Team A and another to Team B. AlertManager works with this kind of flexible structure.
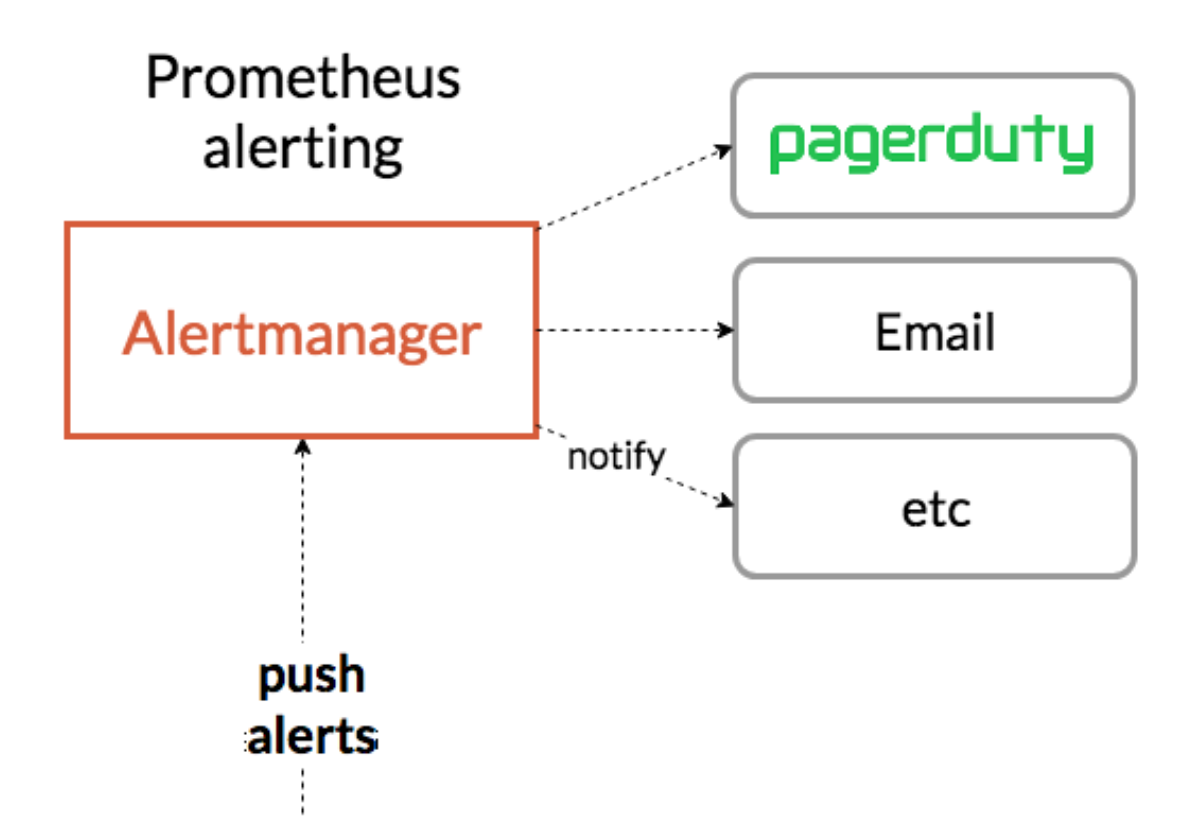
In other words, instead of building this flexible alert-related mechanism into Prometheus itself, the component is deliberately separated so that each lifecycle is isolated. AlertManager can then develop more specifically and quickly for alerting.
PromQL
PromQL stands for Prometheus Query Language. It will be introduced in more detail later, but it is very simple and well suited to time-series data. One excellent point of PromQL is that it can filter by Metrics labels. For example, instance names, IP addresses, and cloud platform regions can be used as labels. Since filtering can be performed with labels registered in Metrics, it is very intuitive.
In addition to filtering, PromQL is widely used for aggregation with functions and for running alerts. PromQL is one of the essential elements to understand when using Prometheus.
Visualization
There are two ways to visualize data in Prometheus. One is to use the built-in web UI provided by Prometheus. A React-based web UI is included with Prometheus, and by accessing the Prometheus endpoint you can run simple Metrics queries. For example, the following figure shows the memory usage of the server running Prometheus. Simple Metrics like this can also be viewed in the web UI.
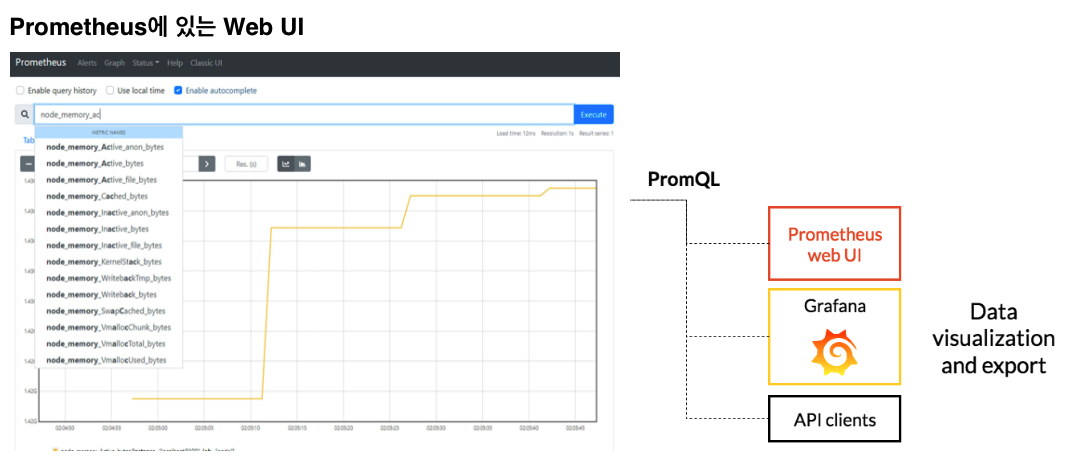
Visualization using the Prometheus web UI
However, if you want more complex panels or want to save existing panels and graphs, this web UI is not enough, so you can use the more specialized and enhanced Grafana. Grafana supports Prometheus, and Prometheus can be selected as a standard data source. The figure below shows a dashboard that displays information from NodeExporter, an Exporter for monitoring servers. This way, you can create quite rich dashboards.
Visualization using Grafana
There are these two options, Grafana and the built-in web UI. This does not mean you should only use Grafana because it has more features. Use Grafana for frequently viewed dashboards or dashboards you want to save, and use the standard Prometheus web UI when issuing ad hoc queries against instances, such as when investigating a failure.
Summary of Prometheus Components
As shown above, Prometheus architecture mainly consists of six components. Seen this way, it is surprisingly simple. Service Discovery is a Prometheus feature itself, so using Prometheus Server is enough for minimal monitoring.
Next
Next, we will discuss CNCF and Observability, which are important topics to know when using Prometheus.