Installing and Starting Prometheus
To start Prometheus, run the binary named prometheus. That is all.
… That is the conclusion, but explaining only that is not very friendly, so this page explains it with a demo.
Install and start Prometheus
First, search for “Prometheus GitHub” in a browser. Open the Prometheus GitHub page, move to the Prometheus repository, and open the Releases page.
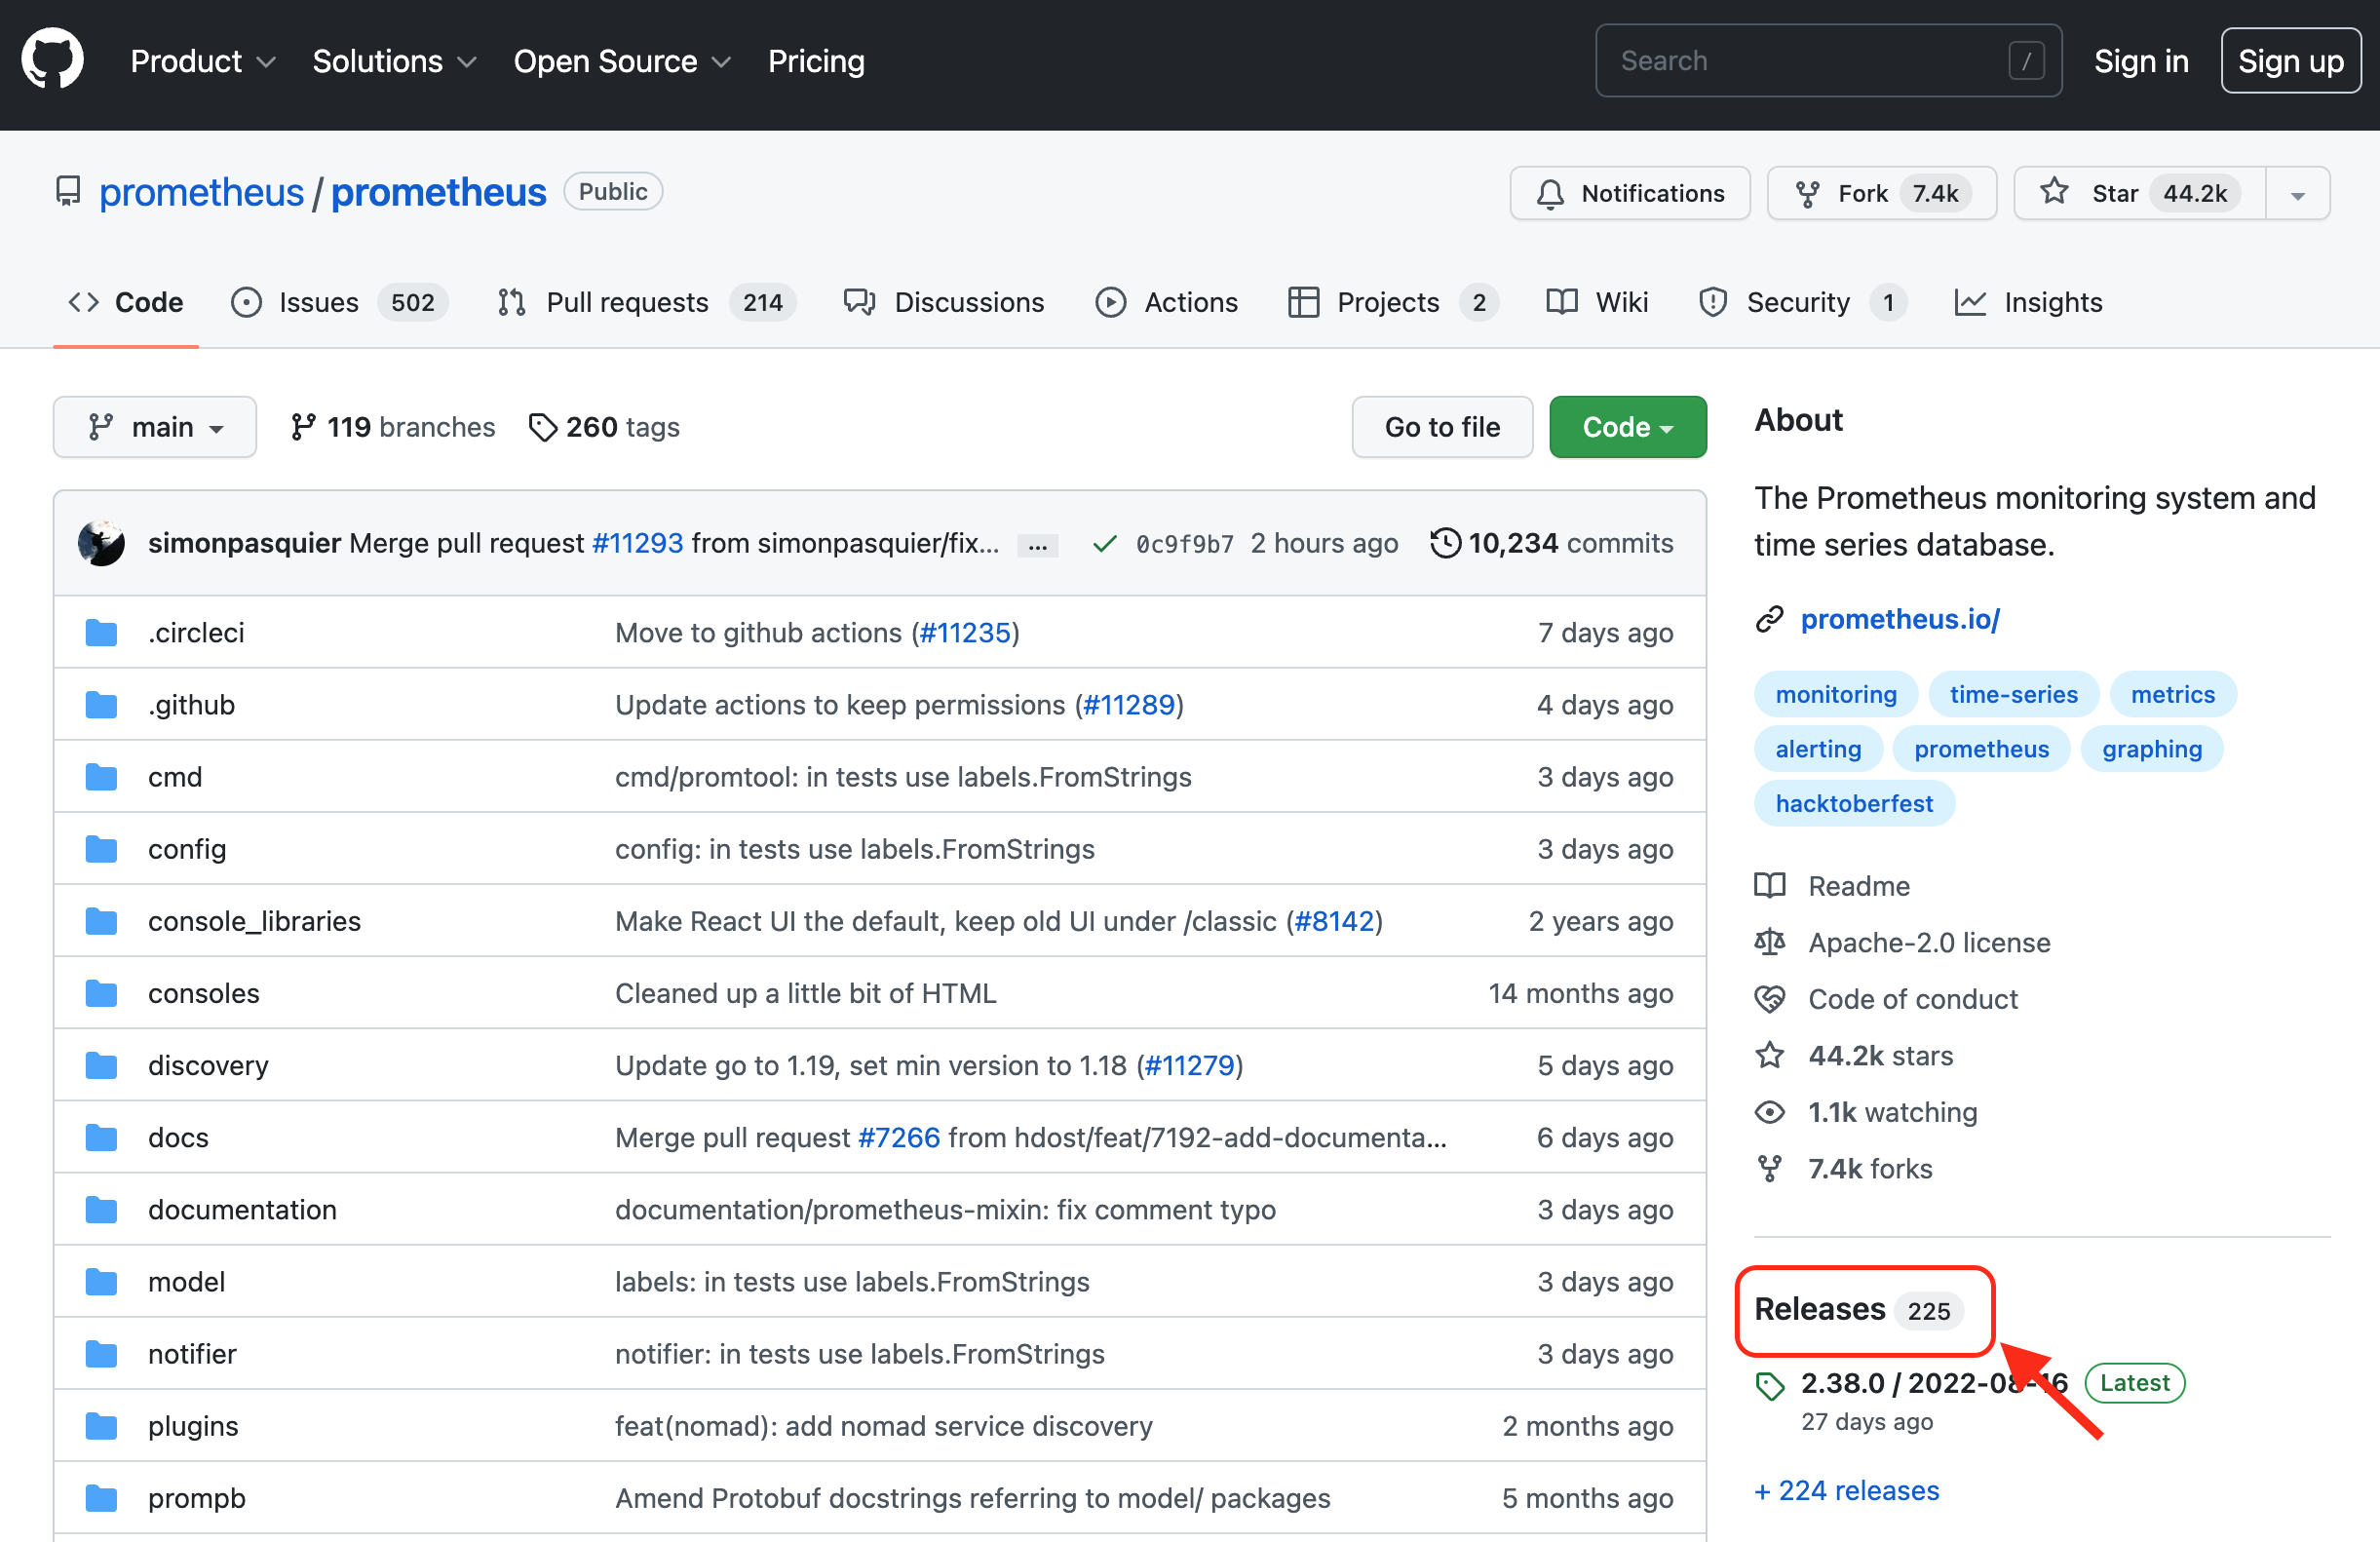
Go to the Prometheus repository on GitHub and click Releases.
One thing to note is that the releases include Latest release and Pre-release. A Pre-release is a beta version, an early release, so it is generally better to use the Latest release.
Scroll down a little.
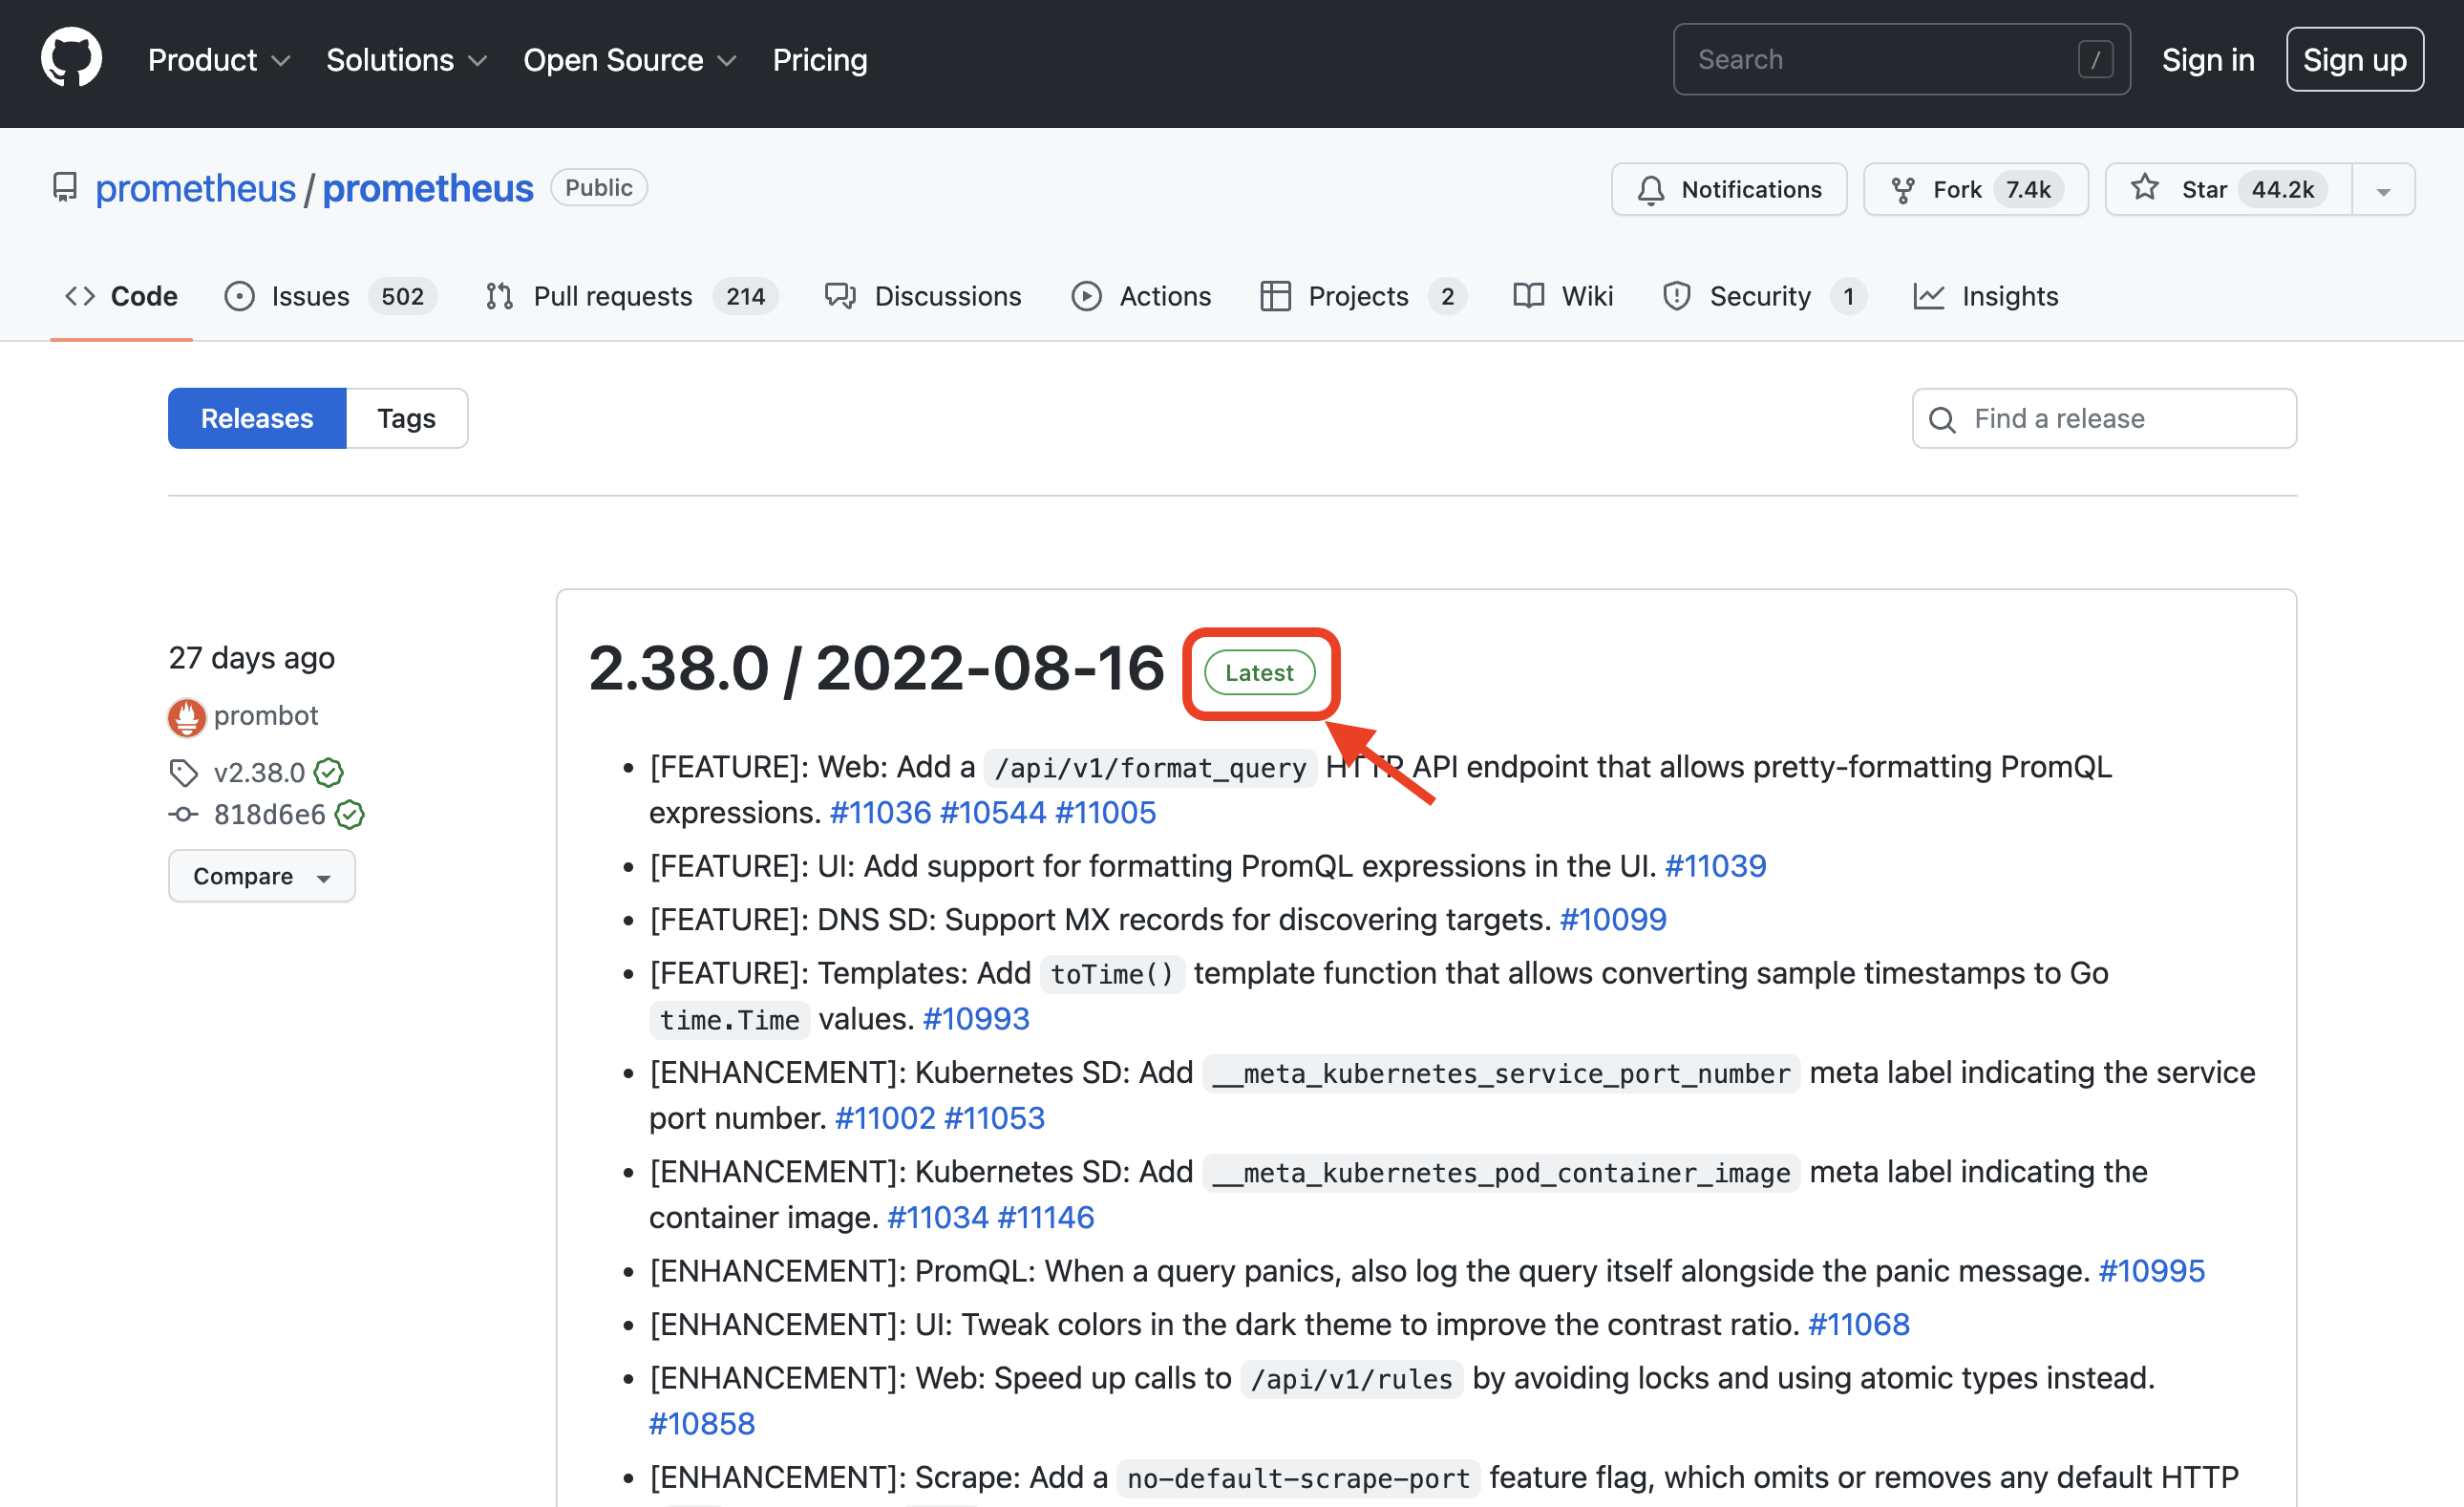
Use the version marked Latest.
Install Prometheus on Linux
Binaries are prepared for each architecture, and this example uses linux-amd64. Copy the archive URL and download it with wget. Since wget completes quickly, extract the downloaded file with tar. A directory is created, and the files are expanded as follows.
$ wget https://github.com/prometheus/prometheus/releases/download/v2.38.0/prometheus-2.38.0.linux-amd64.tar.gz
$ tar xfz prometheus-2.38.0.linux-amd64.tar.gz
$ cd prometheus-2.38.0.linux-amd64
$ ls -aF
./                 LICENSE            console_libraries/ prometheus*        promtool*
../                NOTICE             consoles/          prometheus.yml
Among these files, prometheus is the Prometheus server itself. Run the following command here to start Prometheus. If your system uses firewall features such as iptables, allow communication on port 9090 before running the command.
$ ./prometheus
Install Prometheus on macOS
It can also be installed easily with Homebrew.
brew install prometheus
Execution result:
% brew install prometheus
Running `brew update --auto-update`...
==> Auto-updated Homebrew!
Updated 1 tap (homebrew/core).
==> New Formulae
antidote                   commitlint                 liblbfgs                   pyyaml                     xctesthtmlreport
apophenia                  ghc@8.10                   objconv                    schemathesis               xwin

You have 3 outdated formulae installed.
You can upgrade them with brew upgrade
or list them with brew outdated.

==> Downloading https://ghcr.io/v2/homebrew/core/prometheus/manifests/2.38.0
######################################################################## 100.0%
==> Downloading https://ghcr.io/v2/homebrew/core/prometheus/blobs/sha256:cc5db7e9f7a224c46e1f426b8a12ae2155ef379b1132922766ecb0a47ef5
==> Downloading from https://pkg-containers.githubusercontent.com/ghcr1/blobs/sha256:cc5db7e9f7a224c46e1f426b8a12ae2155ef379b11329227
######################################################################## 100.0%
==> Pouring prometheus--2.38.0.arm64_monterey.bottle.tar.gz
==> Caveats
When run from `brew services`, `prometheus` is run from
`prometheus_brew_services` and uses the flags in:
   /opt/homebrew/etc/prometheus.args

To restart prometheus after an upgrade:
  brew services restart prometheus
Or, if you don't want/need a background service you can just run:
  /opt/homebrew/opt/prometheus/bin/prometheus_brew_services
==> Summary
🍺  /opt/homebrew/Cellar/prometheus/2.38.0: 22 files, 204.0MB
==> Running `brew cleanup prometheus`...
Disable this behaviour by setting HOMEBREW_NO_INSTALL_CLEANUP.
Hide these hints with HOMEBREW_NO_ENV_HINTS (see `man brew`).
After installation, start the service.
brew services start prometheus
Execution result:
% brew services start prometheus
==> Tapping homebrew/services
Cloning into '/opt/homebrew/Library/Taps/homebrew/homebrew-services'...
remote: Enumerating objects: 2094, done.
remote: Counting objects: 100% (4/4), done.
remote: Compressing objects: 100% (4/4), done.
remote: Total 2094 (delta 0), reused 0 (delta 0), pack-reused 2090
Receiving objects: 100% (2094/2094), 586.80 KiB | 11.74 MiB/s, done.
Resolving deltas: 100% (927/927), done.
Tapped 1 command (45 files, 741.4KB).
==> Successfully started `prometheus` (label: homebrew.mxcl.prometheus)
Conversely, the command to stop the service is as follows.
brew services stop prometheus
Execution result:
% brew services stop prometheus
Stopping `prometheus`... (might take a while)
==> Successfully stopped `prometheus` (label: homebrew.mxcl.prometheus)
Check after Prometheus installation
After Prometheus is running, connect to port 9090 on the host where it is running. Access the following URL.
http://(host IP address):9090/
Or, if it is installed locally, access localhost.
http://localhost:9090/
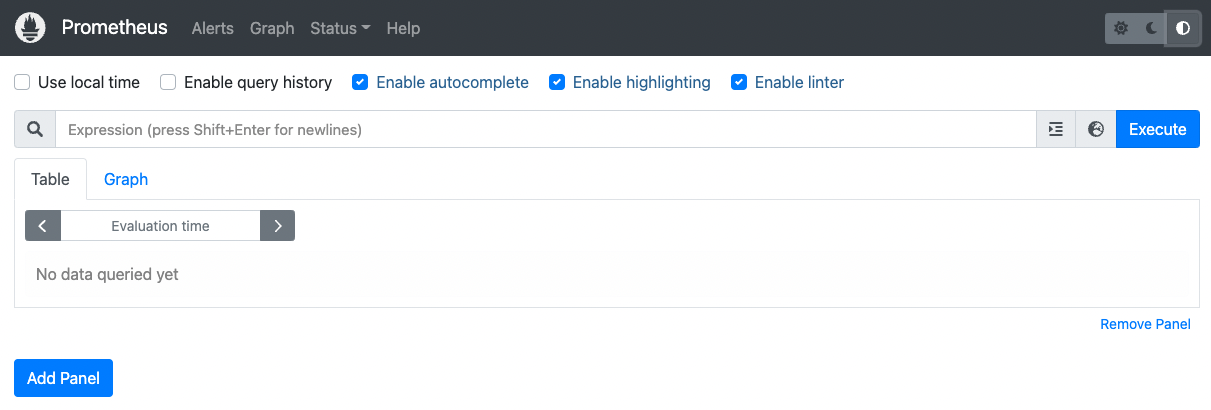
Screen after starting Prometheus
This completes the minimal installation and configuration. It is very simple.
Use Node Exporter
At this point, nothing is being monitored, so let’s also use Node Exporter.
Earlier, when discussing Prometheus, we mentioned that there are many exporters. Let’s look at that a bit more. If you search for “Prometheus Exporter”, you will find a page called Exporters and Integrations. Opening it shows many links. These are all Prometheus exporters.

Prometheus Exporter page
Here, use Node Exporter from that list. It is listed as “Node/system metrics exporter”. It is a metrics exporter for collecting metric information from systems such as Linux.
Install Node Exporter on Linux
As with Prometheus, go to the Releases page, copy the linux-amd64 link, and download it with wget. Then extract it, enter the node_exporter directory, and run the command.
$ wget https://github.com/prometheus/node_exporter/releases/download/v1.3.1/node_exporter-1.3.1.linux-amd64.tar.gz
$ tar xfz node_exporter-1.3.1.linux-amd64.tar.gz
$ cd node_exporter-1.3.1.linux-amd64
$ ./node_exporter
If it starts and the following log appears, it is working.
msg="Listening on" address=9100
Install Node Exporter on macOS
brew install node_exporter
Execution result:
% brew install node_exporter
==> Auto-updated Homebrew!
Updated 1 tap (homebrew/core).

You have 3 outdated formulae installed.
You can upgrade them with brew upgrade
or list them with brew outdated.

==> Downloading https://ghcr.io/v2/homebrew/core/node_exporter/manifests/1.3.1
######################################################################## 100.0%
==> Downloading https://ghcr.io/v2/homebrew/core/node_exporter/blobs/sha256:8e99e508cef6d2a24256e593f93b74e2963ad1cc7e5c2afd00a5b8c2a
==> Downloading from https://pkg-containers.githubusercontent.com/ghcr1/blobs/sha256:8e99e508cef6d2a24256e593f93b74e2963ad1cc7e5c2afd
######################################################################## 100.0%
==> Pouring node_exporter--1.3.1.arm64_monterey.bottle.tar.gz
==> Caveats
When run from `brew services`, `node_exporter` is run from
`node_exporter_brew_services` and uses the flags in:
  /opt/homebrew/etc/node_exporter.args

To restart node_exporter after an upgrade:
  brew services restart node_exporter
Or, if you don't want/need a background service you can just run:
  /opt/homebrew/opt/node_exporter/bin/node_exporter_brew_services
==> Summary
🍺  /opt/homebrew/Cellar/node_exporter/1.3.1: 11 files, 15.3MB
==> Running `brew cleanup node_exporter`...
Disable this behaviour by setting HOMEBREW_NO_INSTALL_CLEANUP.
Hide these hints with HOMEBREW_NO_ENV_HINTS (see `man brew`).
After installation, start the service.
brew services start node_exporter
Execution result:
% brew services start node_exporter
==> Successfully started `node_exporter` (label: homebrew.mxcl.node_exporter)
Check after Node Exporter installation
Now let’s see where exporter information should be written when using Prometheus.
If you installed it from downloaded files, open prometheus.yml in the installed folder. If you installed it with Homebrew, open the YAML file in /opt/homebrew/etc/. The file is written in the following form.
global:
  scrape_interval: 15s

scrape_configs:
  - job_name: "prometheus"
    static_configs:
    - targets: ["localhost:9090"]
The scrape_configs item in this file contains Prometheus settings, especially monitoring target settings. Specifically, each target has a job_name and settings. The job_name is prometheus, and targets are added to static_configs. static_configs is a target addition feature provided separately from Prometheus Service Discovery, allowing target information to be collected statically. By using it this way, you can easily monitor targets simply by passing a server IP address or FQDN as before.
This time, use static_configs to monitor the Node Exporter downloaded earlier. Since Node Exporter listens on port 9100, write and save the file as follows.
global:
  scrape_interval: 15s

scrape_configs:
  - job_name: "prometheus"
    static_configs:
    - targets: ["localhost:9090"]
  - job_name: 'node'
    static_configs:
    - targets: ['localhost:9100']
Next, restart Prometheus as follows.
On Linux: Stop the command line with Ctrl+C, then start it again with the command below.
$ ./prometheus
On macOS with Homebrew: Stop the brew service and start it again.
% brew services stop prometheus
Stopping `prometheus`... (might take a while)
==> Successfully stopped `prometheus` (label: homebrew.mxcl.prometheus)

% brew services start prometheus
==> Successfully started `prometheus` (label: homebrew.mxcl.prometheus)
Now let’s look at the running Prometheus. First, click Status > Targets in the top menu.
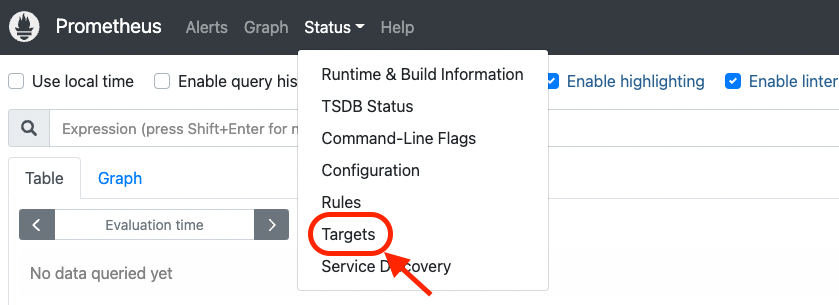
Click Targets in Status
Then you can see that node and prometheus are running as follows.
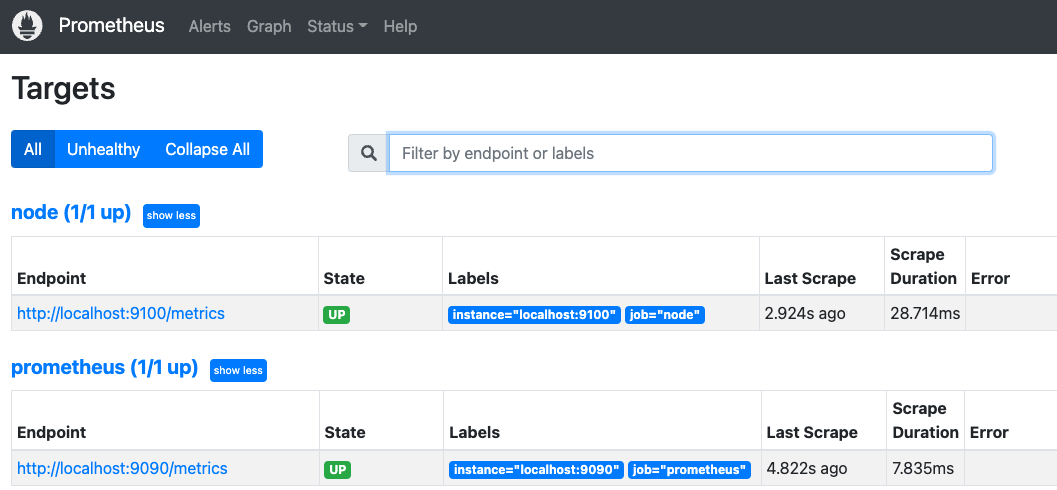
Targets screen
Go to the home screen. If you want to see the memory usage of this server, enter node in the input form at the top of the screen. A large number of metrics are displayed as candidates. If you want to narrow them down to memory-related metrics, add memory to the form. Memory-related information is shown. This time, select node_memory_active_bytes.
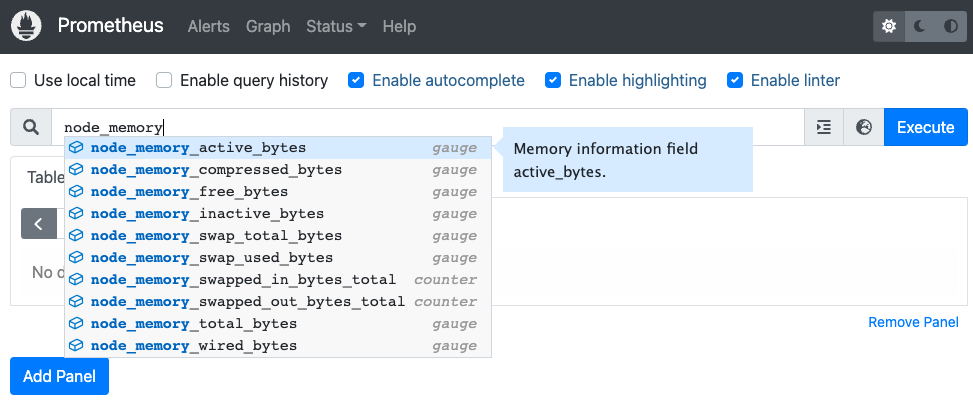
Select node_memory_active_bytes
Then values are displayed as shown below. The unit is bytes.
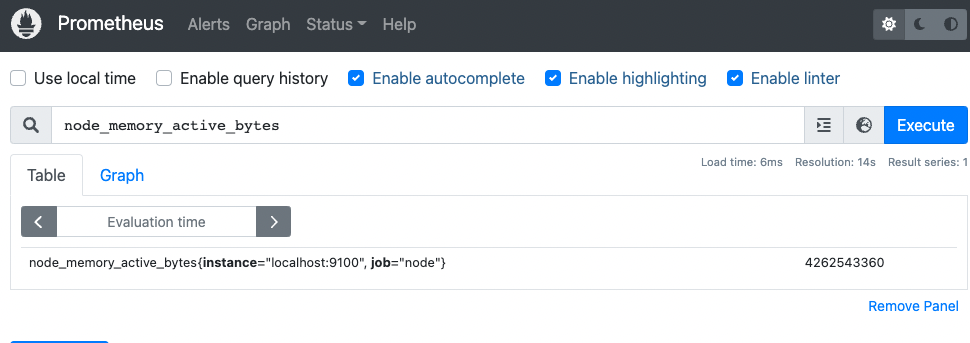
Where node_memory_active_bytes was executed
Also, if you open the Graph tab at the top, a graph is displayed.
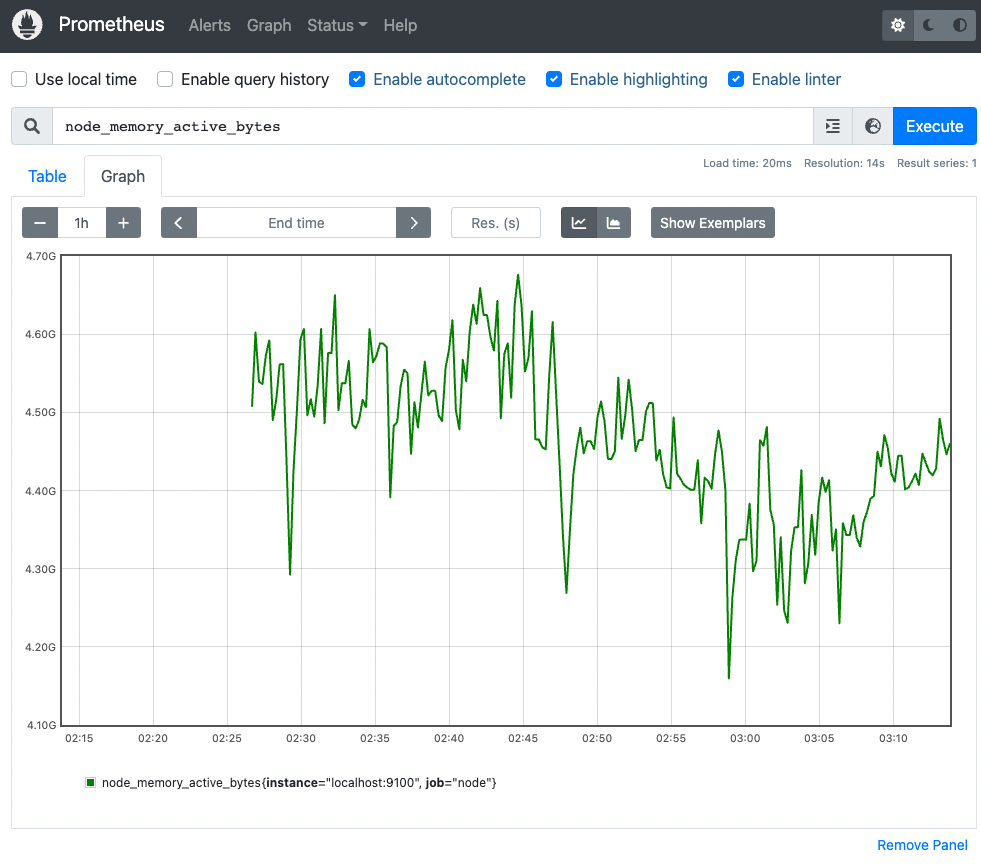
This was only the memory usage obtained earlier, but if you want a usage rate, you can divide the current value by the total. If you obtain the total memory capacity, it can be calculated. A metric called node_memory_total_bytes is prepared for that. Using it, you can write an expression in the form and view a usage-rate graph.
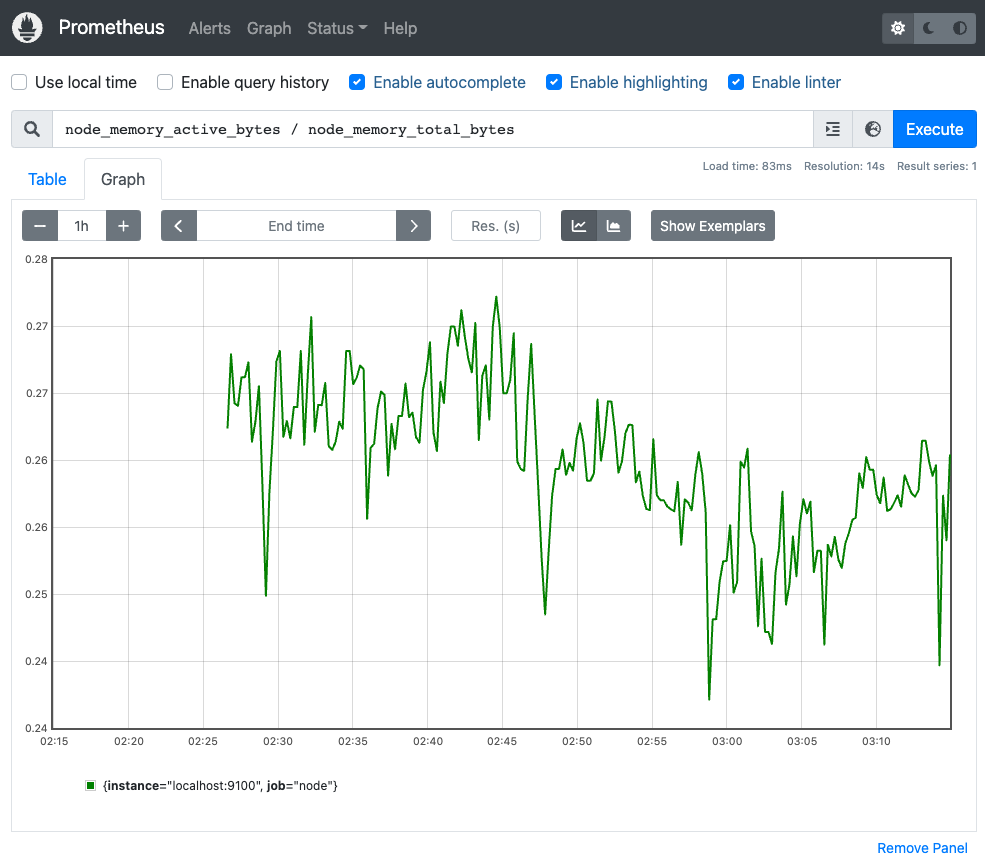
The memory usage graph has decimal values on the Y-axis, but if you want to display it as a percentage, enter node_memory_active_bytes / node_memory_total_bytes * 100.
In this way, Prometheus can implement monitoring very easily and can also run queries.
Other elements
The demo ends here. Next, let’s briefly discuss other elements of Prometheus.
Prometheus storage
Prometheus storage basically keeps data locally and creates blocks every two hours. These blocks contain several kinds of data, such as Chunk data, Index data, and Meta data, and the actually collected metrics are stored through these data structures. Data from the most recent period of less than two hours is used in memory, and WAL (Write Ahead Log) is prepared in case of a crash. This structure is simple, but conversely, it does not provide standalone redundancy or persistence mechanisms.
.
├── 01GCTTBW7XCBK1VE15SR6698EB
│   ├── chunks
│   │   └── 000001
│   ├── index
│   ├── meta.json
│   └── tombstones
├── chunks_head
│   ├── 000005
│   └── 000006
├── lock
├── queries.active
└── wal
    ├── 00000004
    ├── 00000005
    ├── 00000006
    └── checkpoint.00000003
        └── 00000000
If installed with Homebrew, the directory location is /opt/homebrew/var/prometheus.
Prometheus data structure
If Prometheus itself does not provide redundancy, what should be done? Such a structure can be placed outside Prometheus. This is called Remote Storage, a mechanism that stores data in an external database. With that database, metrics can be sent to it or read from it. Many databases are supported, including PostgreSQL, Graphite, InfluxDB, M3DB, Cortex, and Thanos. These databases may directly support Prometheus Remote Storage, and even if they do not, adapters exist. With adapters, metrics can be passed in an appropriate form.

Using Remote Storage through an adapter
If Prometheus is used in production, keeping data locally may be acceptable, but if the retention period is long or the data volume is large, using Remote Storage is likely a good idea.
PromQL
PromQL is a language for extracting and aggregating metrics. Filtering by labels can be introduced briefly as follows.
Using only the metric name:
prometheus_http_requests_total
Filtering by label:
prometheus_http_requests_total{job="apiserver", handler="/api/v1/rules"}
Filtering by regular expression:
prometheus_http_requests_total{job=~".*server"}
Using a function:
rate(prometheus_http_requests_total[5m])
The first example simply uses only the metric name. In the earlier demo, metrics such as node_memory_total_bytes and node_memory_active_bytes were used; these simply retrieve the metrics themselves.
This time there was only one server, so one metric was handled. If multiple servers or components exist, filtering for each one is necessary. In that case, use label filtering as shown in the second example. Labels are specified by placing {...} after the metric name. In this example, job is apiserver, but earlier there were jobs such as node and prometheus. If you put node in job, you can extract only metrics obtained by Node Exporter, and if you specify prometheus, you can easily extract only Prometheus metrics.
In addition, regular-expression filtering is possible, and extracted metrics can be processed with functions.
Summary
Prometheus is one of the cloud-native system monitoring software options. Its major characteristic is that it is very simple and easy to use.
Although not introduced here, Prometheus also has powerful Service Discovery features. If you use Kubernetes or a cloud platform, it is especially worth trying.
Also, by integrating with AlertManager or Grafana, you can use features that Prometheus alone does not provide. Conversely, if you do not need advanced visualization or alerting and only want simple data collection and lightweight searching, Prometheus alone is sufficient. If you only want alerting, use AlertManager; if you do not need alerting and only want visualization, combine it with Grafana. It can be combined and integrated in that way.
Finally, when using Prometheus, remember that Prometheus is one tool for realizing Observability, and it should be used from that perspective.