Prometheus, CNCF, and Observability
Prometheus and CNCF
Prometheus is hosted as one of the projects of an organization called CNCF, the Cloud Native Computing Foundation. Many people are probably familiar with the Linux Foundation. CNCF is one of the Linux Foundation’s organizations, and it promotes cloud native open source projects. CNCF is a community that encourages people to use more software that is needed for cloud native environments, helps that software grow, and supports it along the way.
CNCF website
Prometheus is actually CNCF’s second Graduated Project. A Graduated Project is often described as a project that has “graduated.”
CNCF projects mainly have three stages: Sandbox, Incubating, and Graduated. Sandbox is the youngest stage. These projects are new, have future potential, but may still have many bugs and few maintainers, so they are considered early-stage projects used by a limited audience. Incubating Projects have gained some recognition and have become more complete as software, but the community state or software maturity is still not sufficient.
Finally, when a project satisfies these conditions to a certain degree, not only in terms of software maturity but also from many viewpoints such as the surrounding community and continuity of maintenance, it is considered able to stand independently even without CNCF support. This state is called Graduated, and Prometheus was recognized as CNCF’s second Graduated Project. Therefore, Prometheus has already been around for quite some time, and because it is one of the graduated projects, it is being used in many places.
The three CNCF project stages also align well with what is called innovation theory. Sandbox projects correspond to innovators, Incubating projects to early adopters, and Graduated Projects to the early majority and later groups.
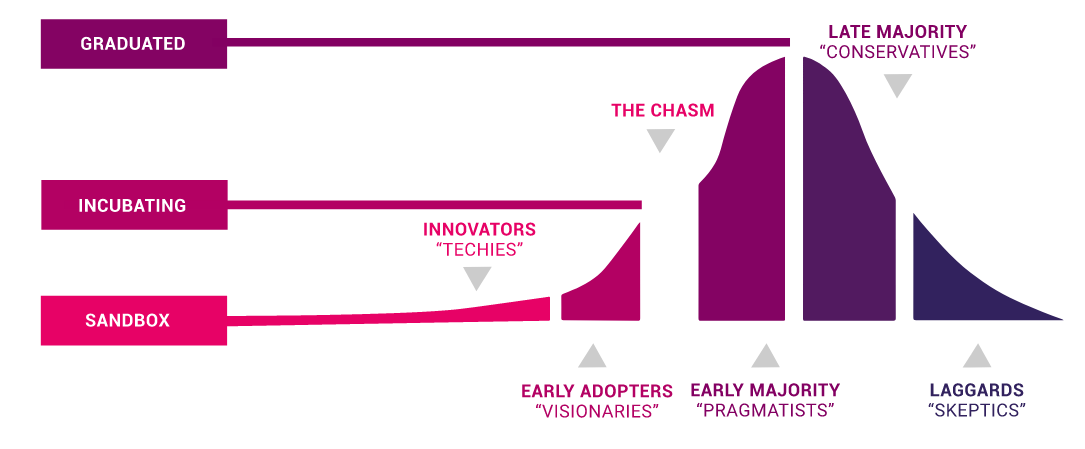
Relationship between CNCF project stages and innovation theory (source)
In innovation theory, there is a concept called the chasm. Between early adopters and the early majority, there is one final gap that must be crossed. Crossing it means that the project is now acceptable for use by a certain number of people, and that even people who want proven technology, such as those working on enterprise systems, can regard it as usable. Prometheus is one of the projects that has become very mature.
However, compared with something like Zabbix, which is quite stable and time-tested, Prometheus is not quite in the same position yet. Its history is still shorter than Zabbix, but even so, it is one of the pieces of software that many people can use with confidence.
What is Observability?
So far, we have talked about Prometheus as a mature cloud native monitoring software. When discussing cloud native, keywords such as containers, service mesh, and microservices often appear, but one keyword that is especially useful to keep in mind when using Prometheus is “Observability.” I encourage you to look up the CNCF site’s definition of “What is cloud native?” Among those ideas, Observability is one important concept, so let’s look at what Observability means in a little more depth.
Before talking about Observability, there is one thing to keep in mind. The word Observability actually means different things to different people. In other words, the opinion or interpretation described here is not universal. Some people may see it from a different perspective. Therefore, rather than treating this explanation as the whole story, it is better to read it as “this is how Observability is being considered here.”
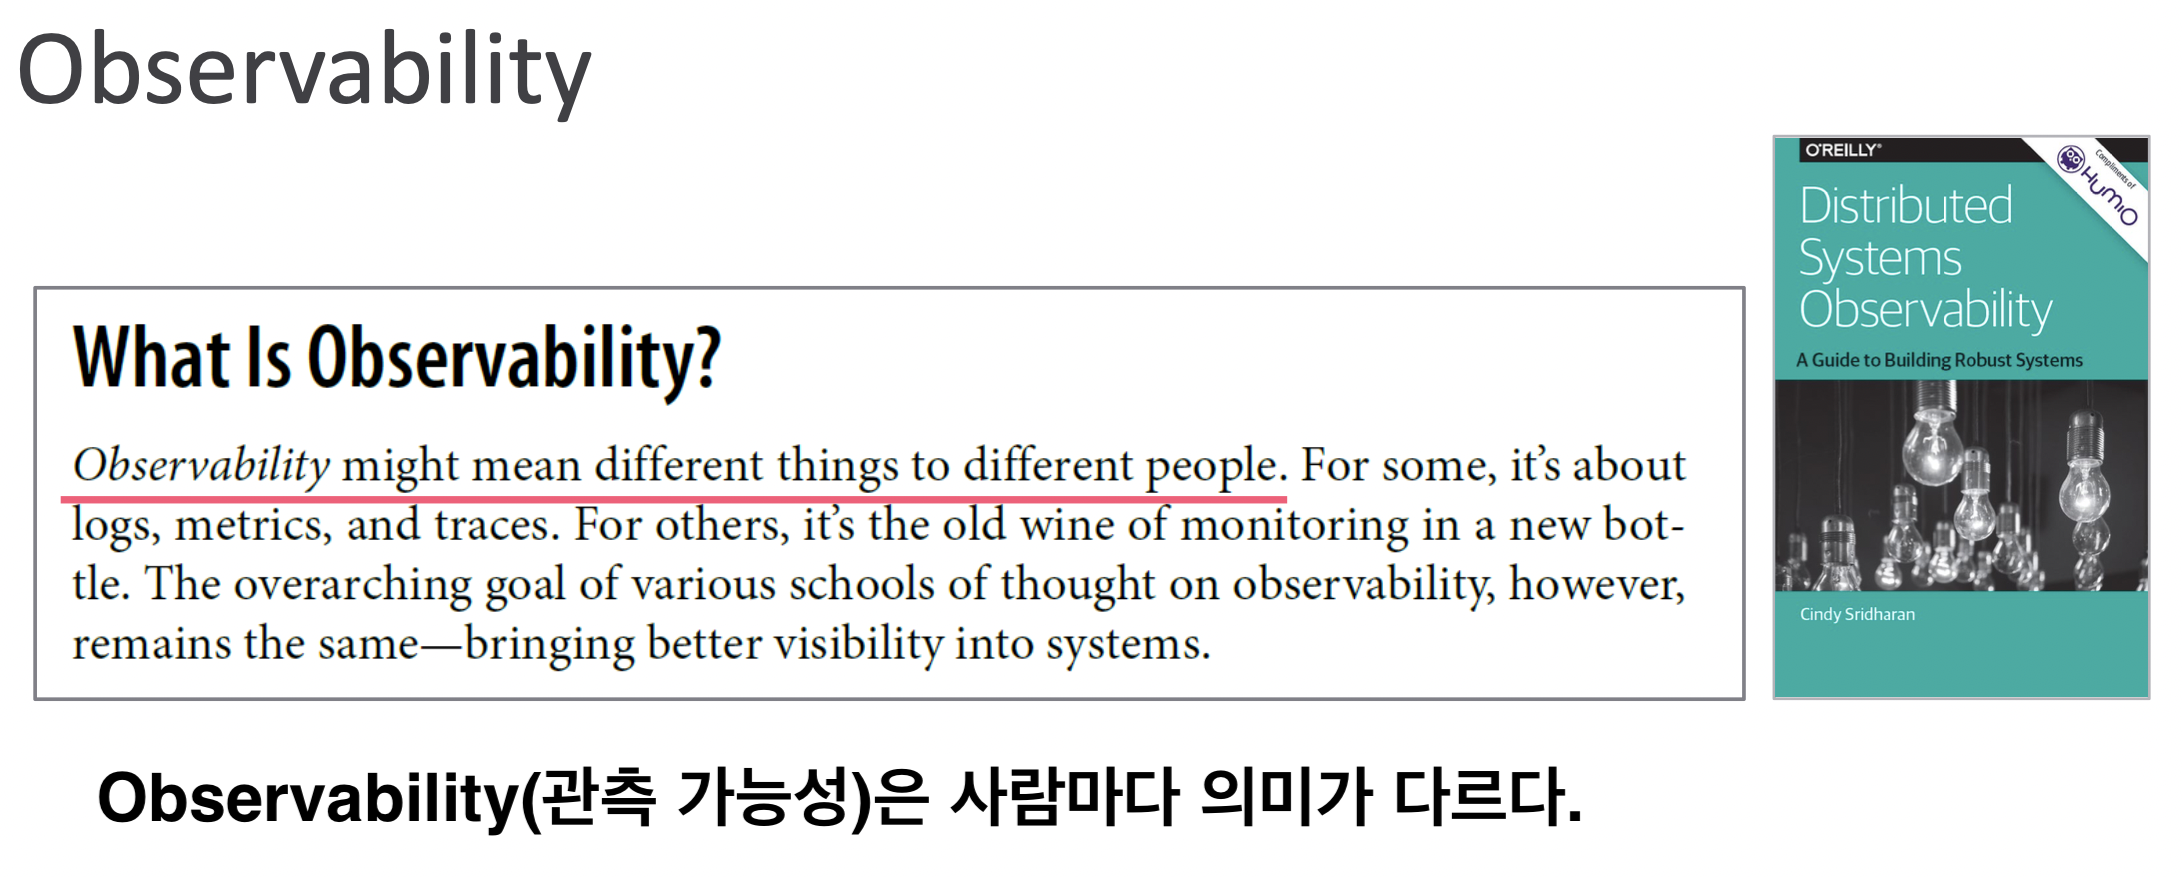 Source: Distributed Systems Observability
Observability can be translated as “the ability to observe.” It means putting a system into a state where its status can be obtained and viewed, or in other words, observed. Let’s look further at what it means to obtain and make visible the state of a system.
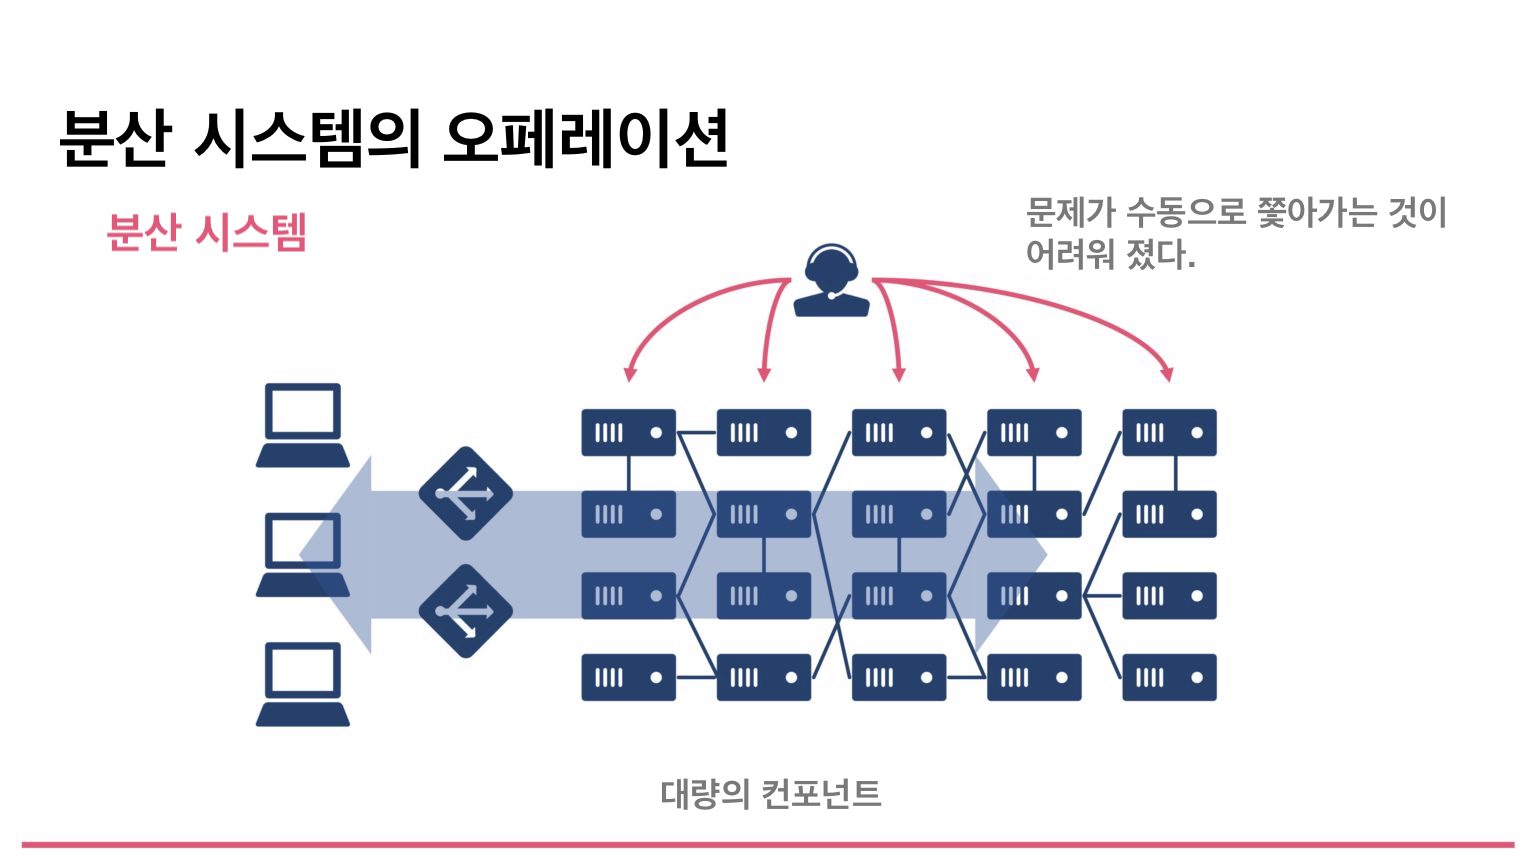
For example, systems from about 10 years ago often used a simple three-tier web model like the figure below, with a load balancer, web servers, application servers, and a database. If a failure occurred in this kind of system, troubleshooting was relatively easy because each component could be traced at the component level.
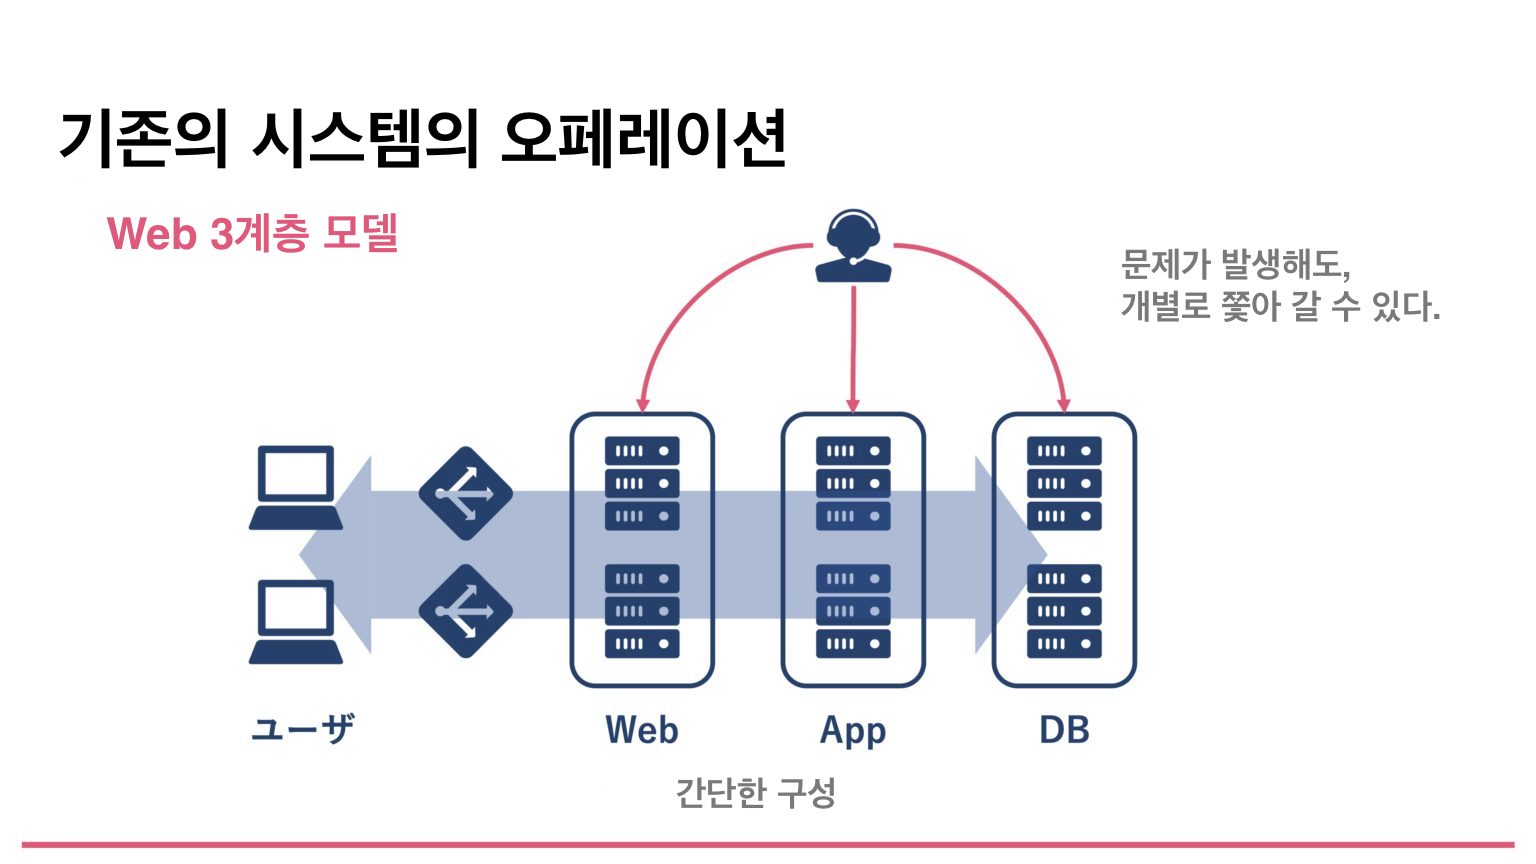
Recently, however, this is the era of Kubernetes and microservices. In these distributed systems, small services are combined and used together. Because a large number of components exist inside a system, manually tracing them one by one when a failure occurs has become extremely difficult. It is almost impossible.
There is a very good example: Twitter’s distributed system. Each spike spread around the circle below is actually a system name. Each line drawn inside the circle is a connection between systems. As systems grow to a certain scale, their structure becomes very complex. Tracing all of this manually is not realistic. Observability is about making the state of such systems visible properly and across the whole system.
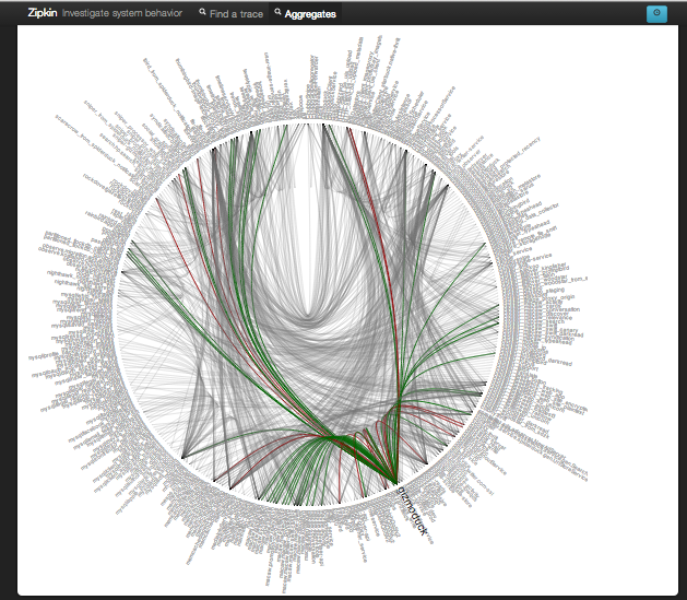
Twitter distributed system (source: Observability at Twitter)
Therefore, it is completely fine to use Prometheus simply as a monitoring tool. However, when using Prometheus, it is worth remembering that Prometheus is one element for realizing Observability. Rather than manually registering many components one by one, you can use Service Discovery to register them more easily. By doing so, work that people previously did manually can be automated, the system itself can take on part of that responsibility, and the environment can move closer to cloud native operation.
Observability and Prometheus
Next, let’s discuss Observability and Prometheus. When talking about Observability, another term to keep in mind is “Telemetry.” Telemetry is one of the elements required of tools used to realize Observability. Observability and Telemetry are not the same thing. Telemetry is interpreted as one element of Observability.
Therefore, simply introducing a tool that provides Telemetry does not by itself realize Observability. In other words, using Prometheus does not automatically mean Observability has been achieved. Prometheus is only a tool for achieving it. The goal in building Observability is not merely to use Prometheus, but to use it effectively so that system state can be made visible across the whole system.
The three elements often mentioned when talking about Telemetry are Metrics, Logging, and Tracing. Some people are probably familiar with Metrics; Zabbix also uses metrics, and most monitoring systems in the world assume metrics. Next is Logging, which is also commonly used. The term that may be less familiar here is Tracing. Distributed tracing has existed for quite a while, but it may not be as familiar.
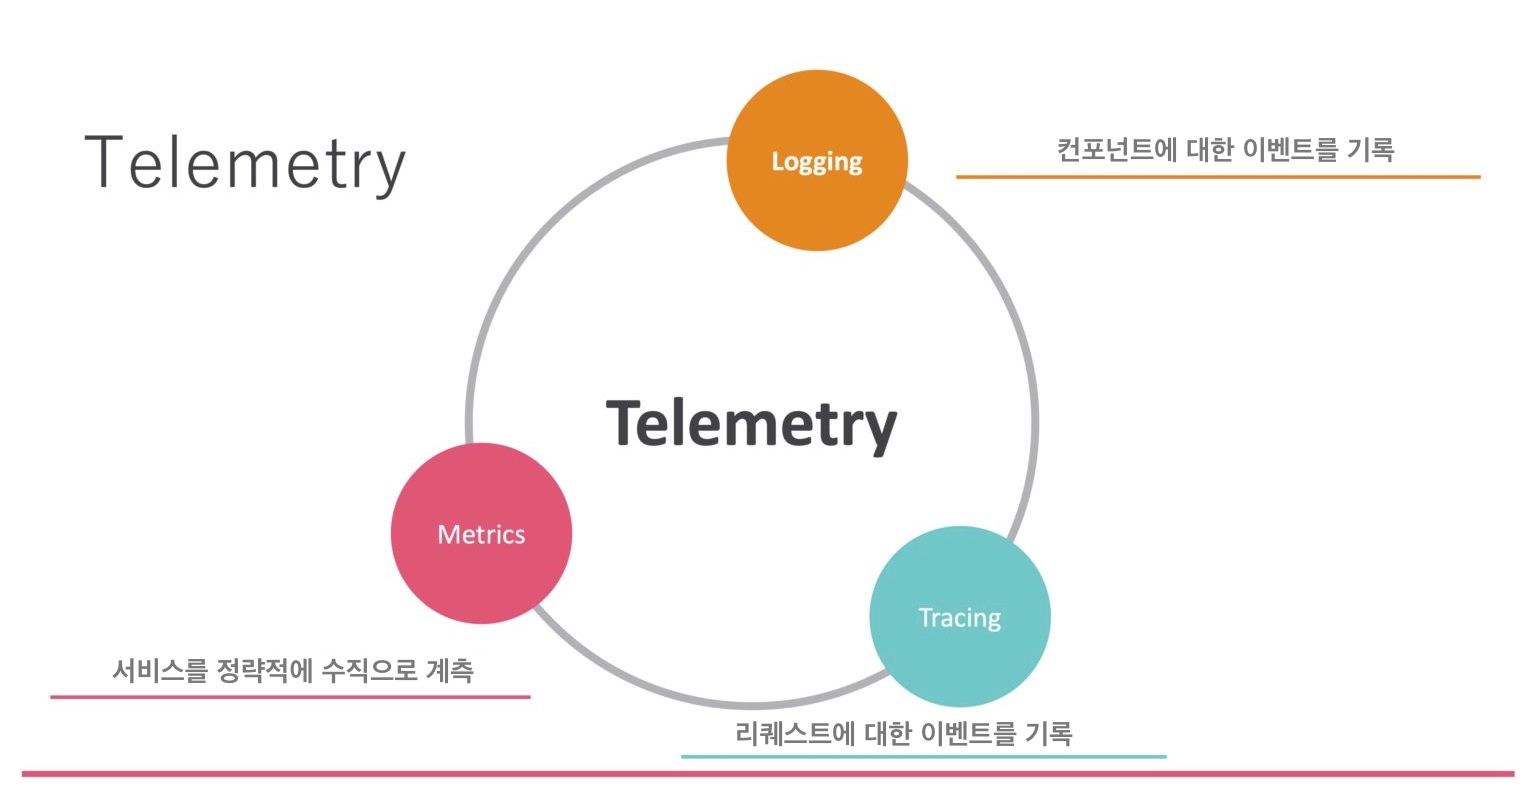
To realize Observability, these three elements need to be handled appropriately. Can Prometheus implement all of them? No. Prometheus is a tool for implementing one of these elements, specifically Metrics. Metrics are continuous numerical data. For example, memory usage was 1 GB at one point, 2 GB at another point, then 3 GB, and then back to 2 GB. These are continuous values arranged as time-series data.
Because this data has a relatively simple structure, statistical aggregation is possible. For example, by looking across a time range, you can understand what changes occurred or how much system resources were used. Through such aggregation, you might discover that metrics rise sharply every Friday because many people access a website after finishing work. As a countermeasure, you could scale up the service or add responding instances. In other words, by using Prometheus, you can aggregate metrics and forecast trends.
Next
Next, we will look at how to actually start using Prometheus.