Application Monitoring with Spring Batch + Prometheus + Pushgateway + Grafana + Docker

Overview
Prometheus basically collects metrics by periodically requesting, or pulling, them from servers that provide metric indicators.
However, there are cases like Spring Batch, where a CLI-style process is simply run periodically. In these cases, there is no separate IP, so metrics must be pushed back to Prometheus rather than collected periodically by polling. Pushgateway is what supports pushing metrics.
Pushgateway
Pushgateway, provided by Prometheus, supports pushing metrics and acts as an intermediary so that Prometheus can pull the pushed metrics. With this structure, Prometheus can retrieve metrics pushed to Pushgateway.

Create a Spring Batch project
Command to create a new project
Create a new Spring Boot project with the curl command as follows.
curl https://start.spring.io/starter.tgz \
-d bootVersion=2.7.6 \
-d dependencies=batch,h2 \
-d baseDir=spring-batch-prometheus \
-d groupId=com.devkuma \
-d artifactId=spring-batch-prometheus \
-d packageName=com.devkuma.batch.prometheus \
-d applicationName=BatchPrometheusApplication \
-d javaVersion=11 \
-d packaging=jar \
-d type=gradle-project | tar -xzvf -
Running the command above adds Spring Batch and H2 Database.
Spring Batch configuration
/src/main/java/com/devkuma/batch/prometheus/BatchPrometheusApplication.java
package com.devkuma.batch.prometheus;

import org.springframework.batch.core.configuration.annotation.EnableBatchProcessing;
import org.springframework.boot.SpringApplication;
import org.springframework.boot.autoconfigure.SpringBootApplication;
import org.springframework.scheduling.annotation.EnableScheduling;

@EnableScheduling
@SpringBootApplication
@EnableBatchProcessing
public class BatchPrometheusApplication {

	public static void main(String[] args) {
		SpringApplication.run(BatchPrometheusApplication.class, args);
	}
}
Add the @EnableBatchProcessing annotation to enable batch features, and add @EnableScheduling to enable scheduler features.
Add Prometheus-related libraries
/build.gradle
// ... omitted ...

dependencies {
	implementation 'org.springframework.boot:spring-boot-starter-batch'
	runtimeOnly 'com.h2database:h2'
	testImplementation 'org.springframework.boot:spring-boot-starter-test'
	testImplementation 'org.springframework.batch:spring-batch-test'

    // Add Prometheus-related libraries
	implementation 'io.micrometer:micrometer-registry-prometheus'
	implementation 'io.prometheus:simpleclient_pushgateway'
}

// ... omitted ...
Looking at the dependency libraries in the file, you can see that Spring Batch-related libraries and Prometheus and Pushgateway libraries have been added.
Implement a Tasklet-style Job configuration
Add a simple Tasklet-style Job configuration file.
/src/main/java/com/devkuma/batch/prometheus/batch/TaskletStepJobConfiguration.java
package com.devkuma.batch.prometheus.batch;

import java.util.Random;

import org.slf4j.Logger;
import org.slf4j.LoggerFactory;
import org.springframework.batch.core.Job;
import org.springframework.batch.core.Step;
import org.springframework.batch.core.configuration.annotation.JobBuilderFactory;
import org.springframework.batch.core.configuration.annotation.StepBuilderFactory;
import org.springframework.batch.repeat.RepeatStatus;
import org.springframework.context.annotation.Bean;
import org.springframework.context.annotation.Configuration;

@Configuration
public class TaskletStepJobConfiguration {

    private static final Logger LOGGER = LoggerFactory.getLogger(TaskletStepJobConfiguration.class);

    private Random random;

    public TaskletStepJobConfiguration() {
        this.random = new Random();
    }

    @Bean
    public Job taskletStepJob(JobBuilderFactory jobBuilderFactory, Step taskletStep1, Step taskletStep2) {
        return jobBuilderFactory.get("taskletStepJob")
                                .start(taskletStep1)
                                .next(taskletStep2)
                                .build();
    }

    @Bean
    public Step taskletStep1(StepBuilderFactory stepBuilderFactory) {
        return stepBuilderFactory.get("taskletStep1")
                                 .tasklet((contribution, chunkContext) -> {
                                     LOGGER.info("taskletStep1");
                                     // simulate processing time
                                     Thread.sleep(random.nextInt(3000));
                                     return RepeatStatus.FINISHED;
                                 })
                                 .build();
    }

    @Bean
    public Step taskletStep2(StepBuilderFactory stepBuilderFactory) {
        return stepBuilderFactory.get("taskletStep2")
                                 .tasklet((contribution, chunkContext) -> {
                                     LOGGER.info("taskletStep2");
                                     // simulate step failure
                                     int nextInt = random.nextInt(3000);
                                     Thread.sleep(nextInt);
                                     if (nextInt % 5 == 0) {
                                         throw new Exception("Boom!");
                                     }
                                     return RepeatStatus.FINISHED;
                                 })
                                 .build();
    }

}
Implement an itemReader and itemWriter-style Job configuration
Create a Job configuration file with a simple itemReader and itemWriter processing style.
/src/main/java/com/devkuma/batch/prometheus/batch/ItemStepJobConfiguration.java
package com.devkuma.batch.prometheus.batch;

import java.util.LinkedList;
import java.util.List;
import java.util.Random;

import org.slf4j.Logger;
import org.slf4j.LoggerFactory;
import org.springframework.batch.core.Job;
import org.springframework.batch.core.Step;
import org.springframework.batch.core.configuration.annotation.JobBuilderFactory;
import org.springframework.batch.core.configuration.annotation.StepBuilderFactory;
import org.springframework.batch.core.configuration.annotation.StepScope;
import org.springframework.batch.item.ItemWriter;
import org.springframework.batch.item.support.ListItemReader;
import org.springframework.context.annotation.Bean;
import org.springframework.context.annotation.Configuration;

@Configuration
public class ItemStepJobConfiguration {

    private static final Logger LOGGER = LoggerFactory.getLogger(ItemStepJobConfiguration.class);

    private Random random;

    public ItemStepJobConfiguration() {
        this.random = new Random();
    }

    @Bean
    public Job itemStepJob(JobBuilderFactory jobBuilderFactory, Step itemStep) {
        return jobBuilderFactory.get("itemStepJob")
                                .start(itemStep)
                                .build();
    }

    @Bean
    public Step itemStep(StepBuilderFactory stepBuilderFactory) {
        return stepBuilderFactory.get("itemStep").<Integer, Integer>chunk(3)
                                 .reader(itemReader())
                                 .writer(itemWriter())
                                 .build();
    }

    @Bean
    @StepScope
    public ListItemReader<Integer> itemReader() {
        List<Integer> items = new LinkedList<>();
        // read a random number of items in each run
        for (int i = 0; i < random.nextInt(100); i++) {
            items.add(i);
        }
        return new ListItemReader<>(items);
    }

    @Bean
    public ItemWriter<Integer> itemWriter() {
        return items -> {
            for (Integer item : items) {
                int nextInt = random.nextInt(1000);
                Thread.sleep(nextInt);
                // simulate write failure
                if (nextInt % 57 == 0) {
                    throw new Exception("Boom!");
                }
                LOGGER.info("item = " + item);
            }
        };
    }
}
Create a Job scheduler
A scheduler is not strictly needed here, but to make the graph easier to observe, create a Job scheduler that sends data periodically.
/src/main/java/com/devkuma/batch/prometheus/batch/JobScheduler.java
package com.devkuma.batch.prometheus.batch;

import org.springframework.batch.core.Job;
import org.springframework.batch.core.JobParameters;
import org.springframework.batch.core.JobParametersBuilder;
import org.springframework.batch.core.launch.JobLauncher;
import org.springframework.beans.factory.annotation.Autowired;
import org.springframework.scheduling.annotation.Scheduled;
import org.springframework.stereotype.Component;

@Component
public class JobScheduler {

	private final Job taskletStepJob;

	private final Job itemStepJob;

	private final JobLauncher jobLauncher;

	@Autowired
	public JobScheduler(Job taskletStepJob, Job itemStepJob, JobLauncher jobLauncher) {
		this.taskletStepJob = taskletStepJob;
		this.itemStepJob = itemStepJob;
		this.jobLauncher = jobLauncher;
	}

	@Scheduled(cron = "*/10 * * * * *")
	public void launchJob1() throws Exception {
		JobParameters jobParameters = new JobParametersBuilder().addLong("time", System.currentTimeMillis())
																.toJobParameters();

		jobLauncher.run(taskletStepJob, jobParameters);
	}

	@Scheduled(cron = "*/15 * * * * *")
	public void launchJob2() throws Exception {
		JobParameters jobParameters = new JobParametersBuilder().addLong("time", System.currentTimeMillis())
																.toJobParameters();

		jobLauncher.run(itemStepJob, jobParameters);
	}

}
Next, add thread.pool.size to the configuration file.
/src/main/resources/application.properties
thread.pool.size=3
Use the thread.pool.size added earlier to create a configuration file for ThreadPoolTaskScheduler.
/src/main/java/com/devkuma/batch/prometheus/batch/SchedulerConfiguration.java
package com.devkuma.batch.prometheus.config;

import org.springframework.beans.factory.annotation.Value;
import org.springframework.context.annotation.Bean;
import org.springframework.context.annotation.Configuration;
import org.springframework.scheduling.concurrent.ThreadPoolTaskScheduler;

@Configuration
public class SchedulerConfiguration {

    @Bean(destroyMethod = "shutdown")
    public ThreadPoolTaskScheduler taskScheduler(@Value("${thread.pool.size}") int threadPoolSize) {
        ThreadPoolTaskScheduler threadPoolTaskScheduler = new ThreadPoolTaskScheduler();
        threadPoolTaskScheduler.setPoolSize(threadPoolSize);
        return threadPoolTaskScheduler;
    }
}
Prometheus configuration
Now configure Prometheus.
/src/main/resources/application.properties
prometheus.push.rate=5000
prometheus.job.name=springbatch
prometheus.grouping.key=appname
prometheus.pushgateway.url=localhost:9091
Add the Prometheus push interval, Job name, and grouping key. Then configure the Pushgateway URL.
Reflect the configured Prometheus settings in a configuration object.
/src/main/java/com/devkuma/batch/prometheus/config/PrometheusConfiguration.java
package com.devkuma.batch.prometheus.config;

import java.util.HashMap;
import java.util.Map;

import javax.annotation.PostConstruct;

import org.slf4j.Logger;
import org.slf4j.LoggerFactory;
import org.springframework.beans.factory.annotation.Value;
import org.springframework.context.annotation.Configuration;
import org.springframework.scheduling.annotation.Scheduled;

import io.micrometer.core.instrument.Metrics;
import io.micrometer.prometheus.PrometheusConfig;
import io.micrometer.prometheus.PrometheusMeterRegistry;
import io.prometheus.client.CollectorRegistry;
import io.prometheus.client.exporter.PushGateway;

@Configuration
public class PrometheusConfiguration {

    private static final Logger LOGGER = LoggerFactory.getLogger(PrometheusConfiguration.class);

    @Value("${prometheus.job.name}")
    private String prometheusJobName;

    @Value("${prometheus.grouping.key}")
    private String prometheusGroupingKey;

    @Value("${prometheus.pushgateway.url}")
    private String prometheusPushGatewayUrl;

    private Map<String, String> groupingKey = new HashMap<>();

    private PushGateway pushGateway;

    private CollectorRegistry collectorRegistry;

    @PostConstruct
    public void init() {
        pushGateway = new PushGateway(prometheusPushGatewayUrl);
        groupingKey.put(prometheusGroupingKey, prometheusJobName);
        PrometheusMeterRegistry prometheusMeterRegistry = new PrometheusMeterRegistry(PrometheusConfig.DEFAULT);
        collectorRegistry = prometheusMeterRegistry.getPrometheusRegistry();
        Metrics.globalRegistry.add(prometheusMeterRegistry);
    }

    @Scheduled(fixedRateString = "${prometheus.push.rate}")
    public void pushMetrics() {
        try {
            pushGateway.pushAdd(collectorRegistry, prometheusJobName, groupingKey);
            LOGGER.info("Push Metrics");
        }
        catch (Throwable ex) {
            LOGGER.error("Unable to push metrics to Prometheus Push Gateway", ex);
        }
    }

}
Start Prometheus + Pushgateway + Grafana servers with Docker
Now create docker-compose.yml and configure Prometheus to start Prometheus + Pushgateway + Grafana servers with Docker.
docker-compose.yml configuration file
/src/prometheus/docker-compose.yml
version: '3.7'
services:

  prometheus:
    image: prom/prometheus
    container_name: 'prometheus'
    ports:
      - '9090:9090'
    volumes:
      - ./prometheus/prometheus.yml:/etc/prometheus/prometheus.yml

  pushgateway:
    image: prom/pushgateway
    container_name: 'pushgateway'
    ports:
      - '9091:9091'

  grafana:
    image: grafana/grafana
    container_name: 'grafana'
    ports:
      - '3000:3000'
prometheus.yml configuration file
/src/docker/prometheus/prometheus.yml
global:
  scrape_interval:     5s
  evaluation_interval: 5s

scrape_configs:
  - job_name: 'springbatch'
    honor_labels: true
    static_configs:
      - targets: ['host.docker.internal:9091'] # pushgateway
Because the test environment is macOS, the Pushgateway URL is written as host.docker.internal:9091; it may differ on Linux and other environments. Enter the URL appropriate for your test environment.
Start Docker
% cd src/prometheus
% docker-compose up -d
Access URLs
-
Pushgateway
- http://localhost:9091
-
Prometheus
- http://localhost:9090
-
Grafana
- http://localhost:3000
- Default account ID/password: admin/admin
- http://localhost:3000
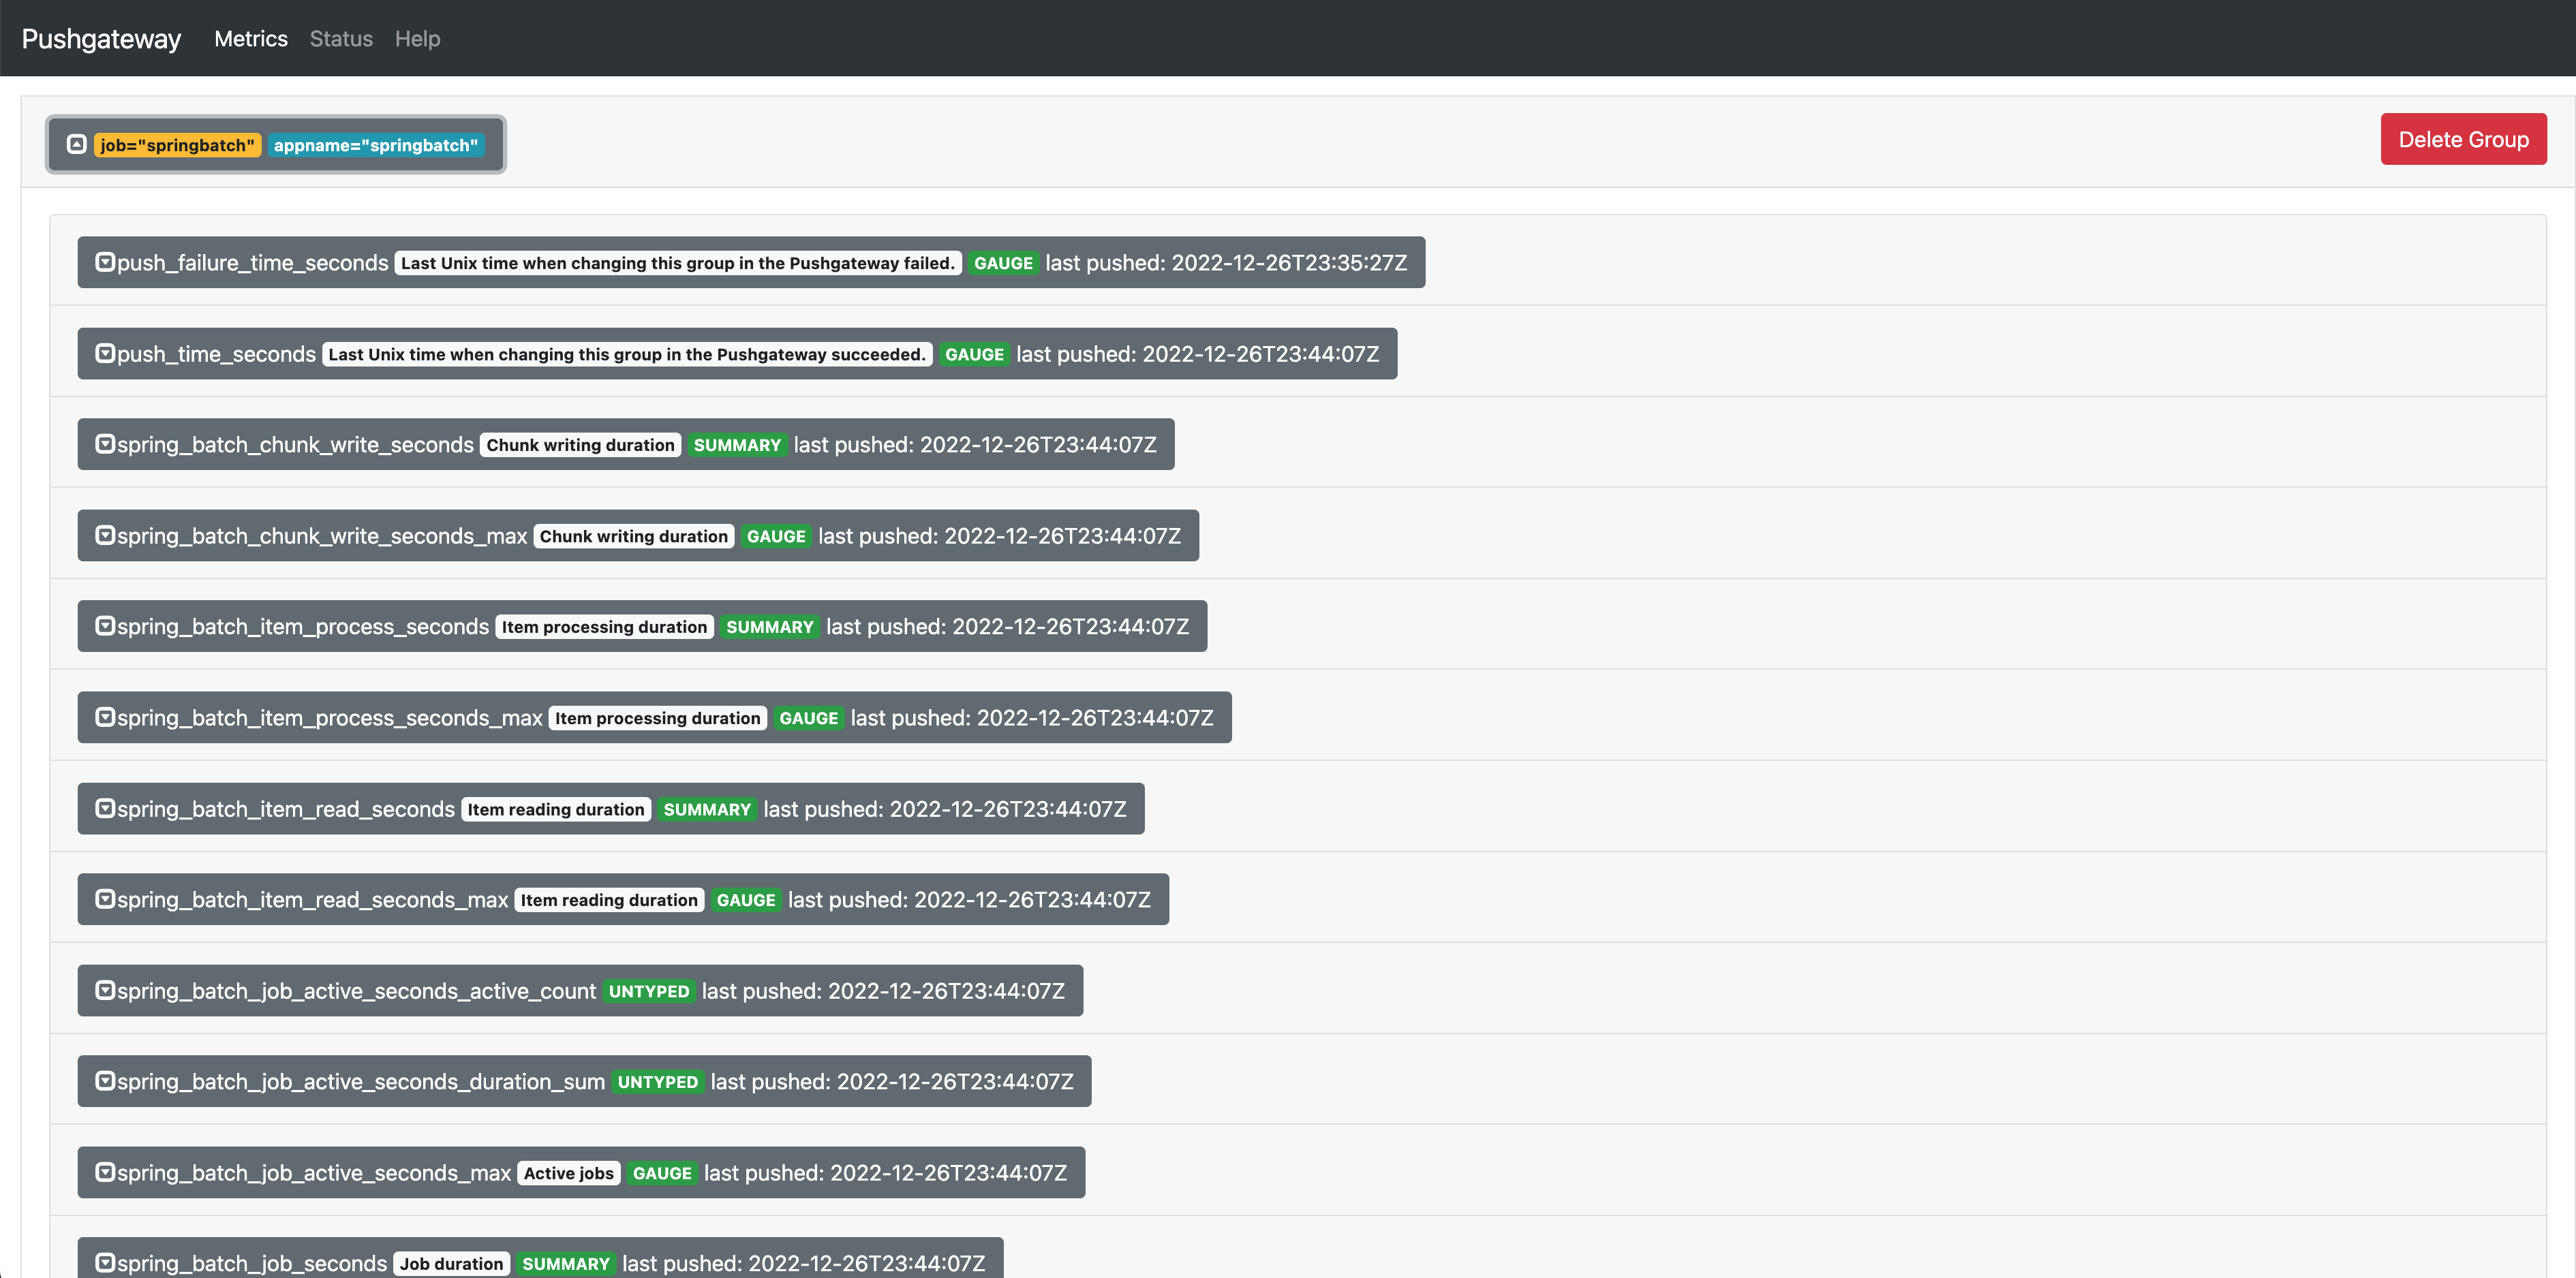
Check Pushgateway collection information
If you access Pushgateway at http://localhost:9091, you can check the information collected from spring-batch.
Check Prometheus collection information
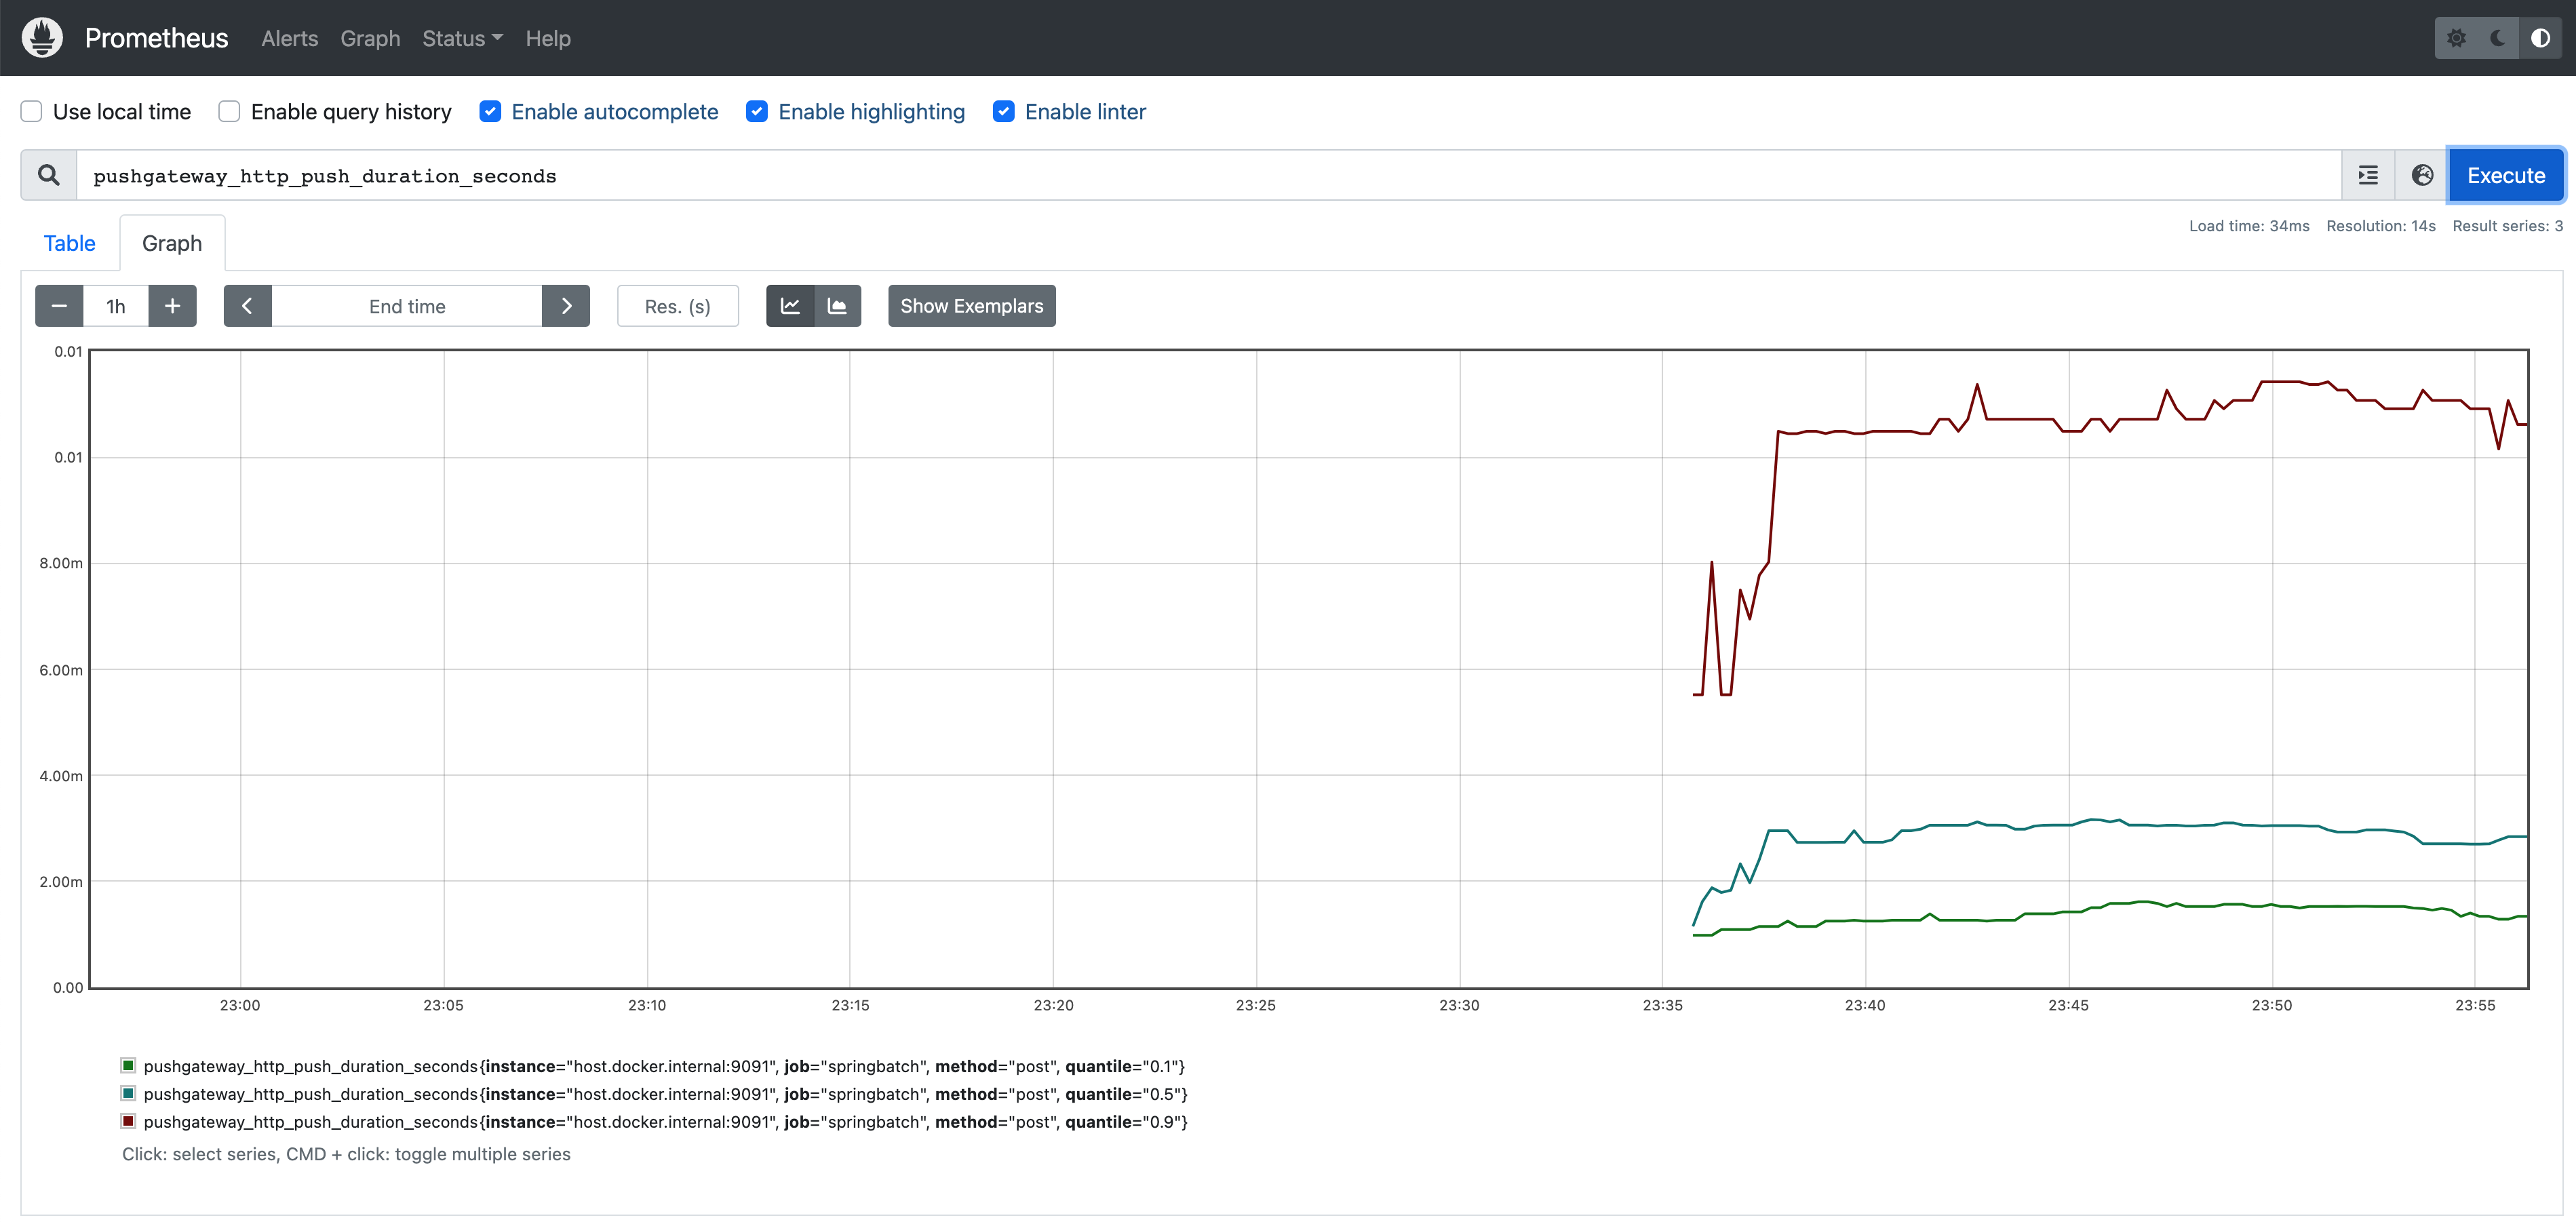
If you access Prometheus at http://localhost:9090, you can check the information collected from spring-batch and delivered through Pushgateway.
Grafana configuration
Now display the information collected from spring-batch more visually through Grafana.
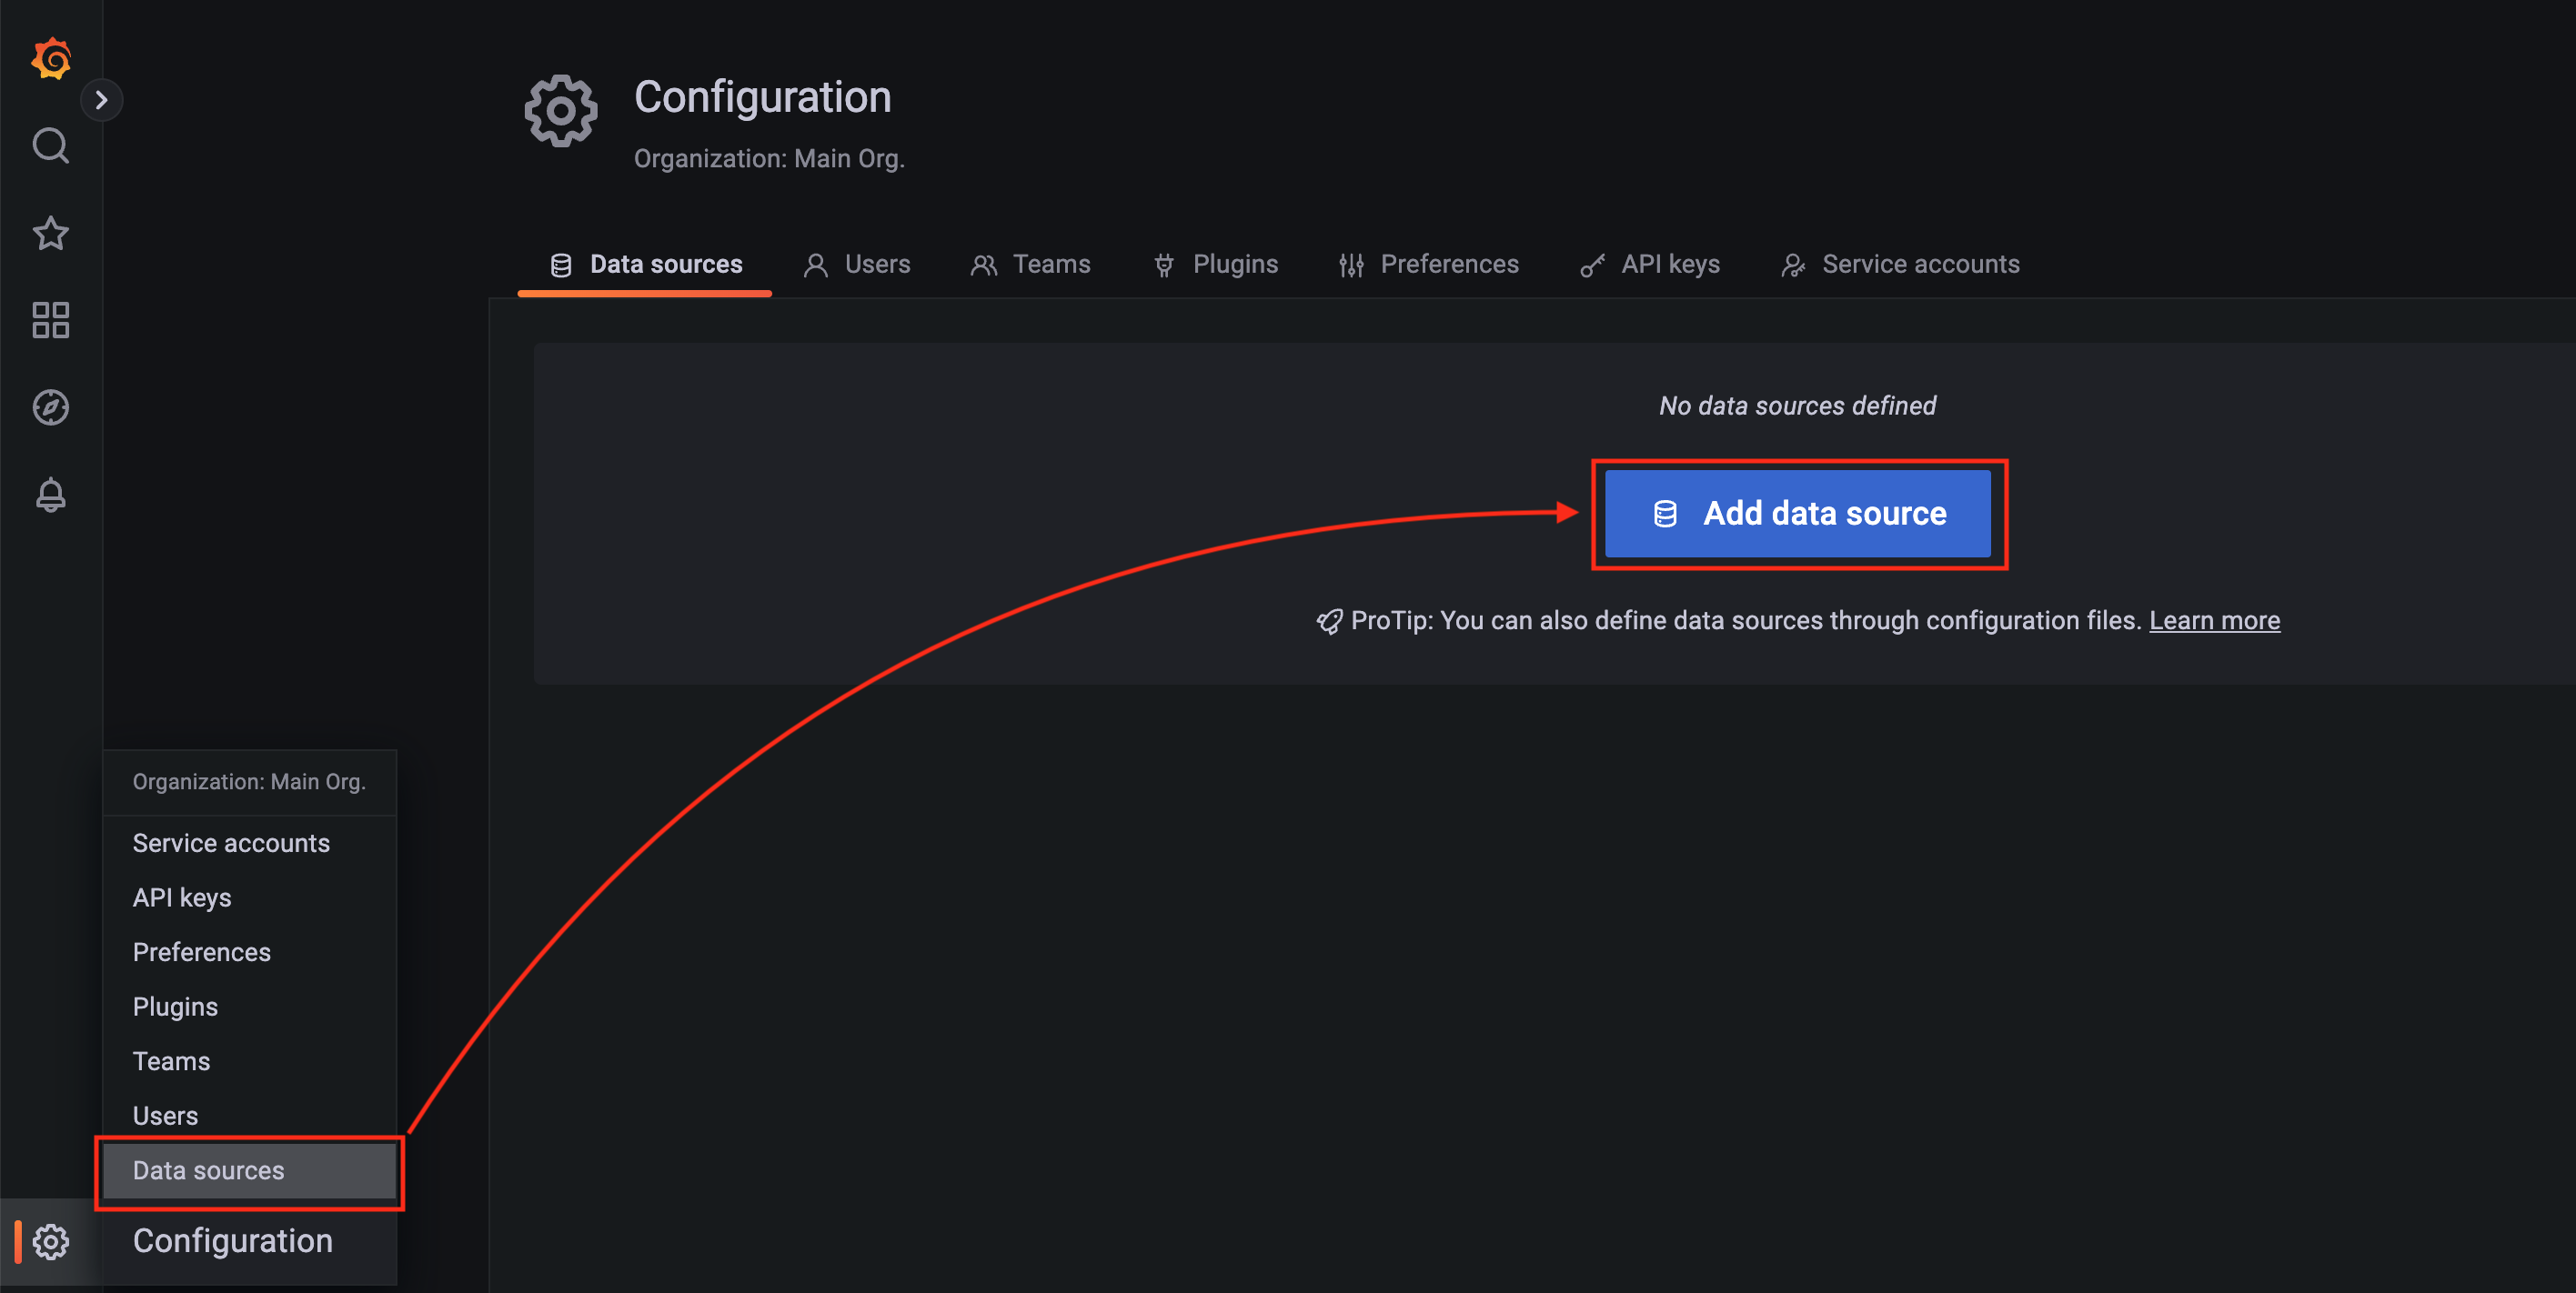
Configure the Grafana data source
First, add a data source.
Select Prometheus as the data source.
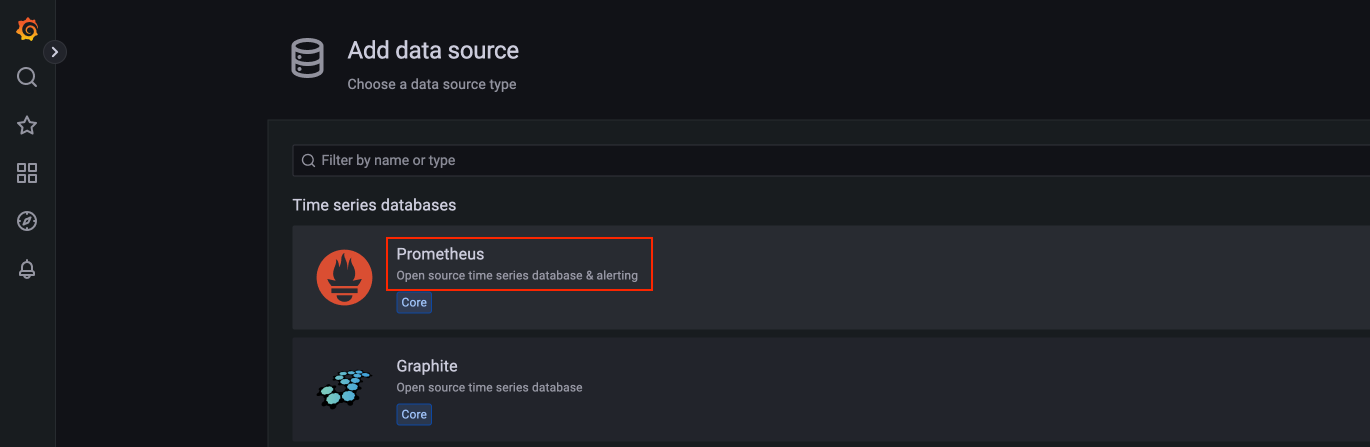
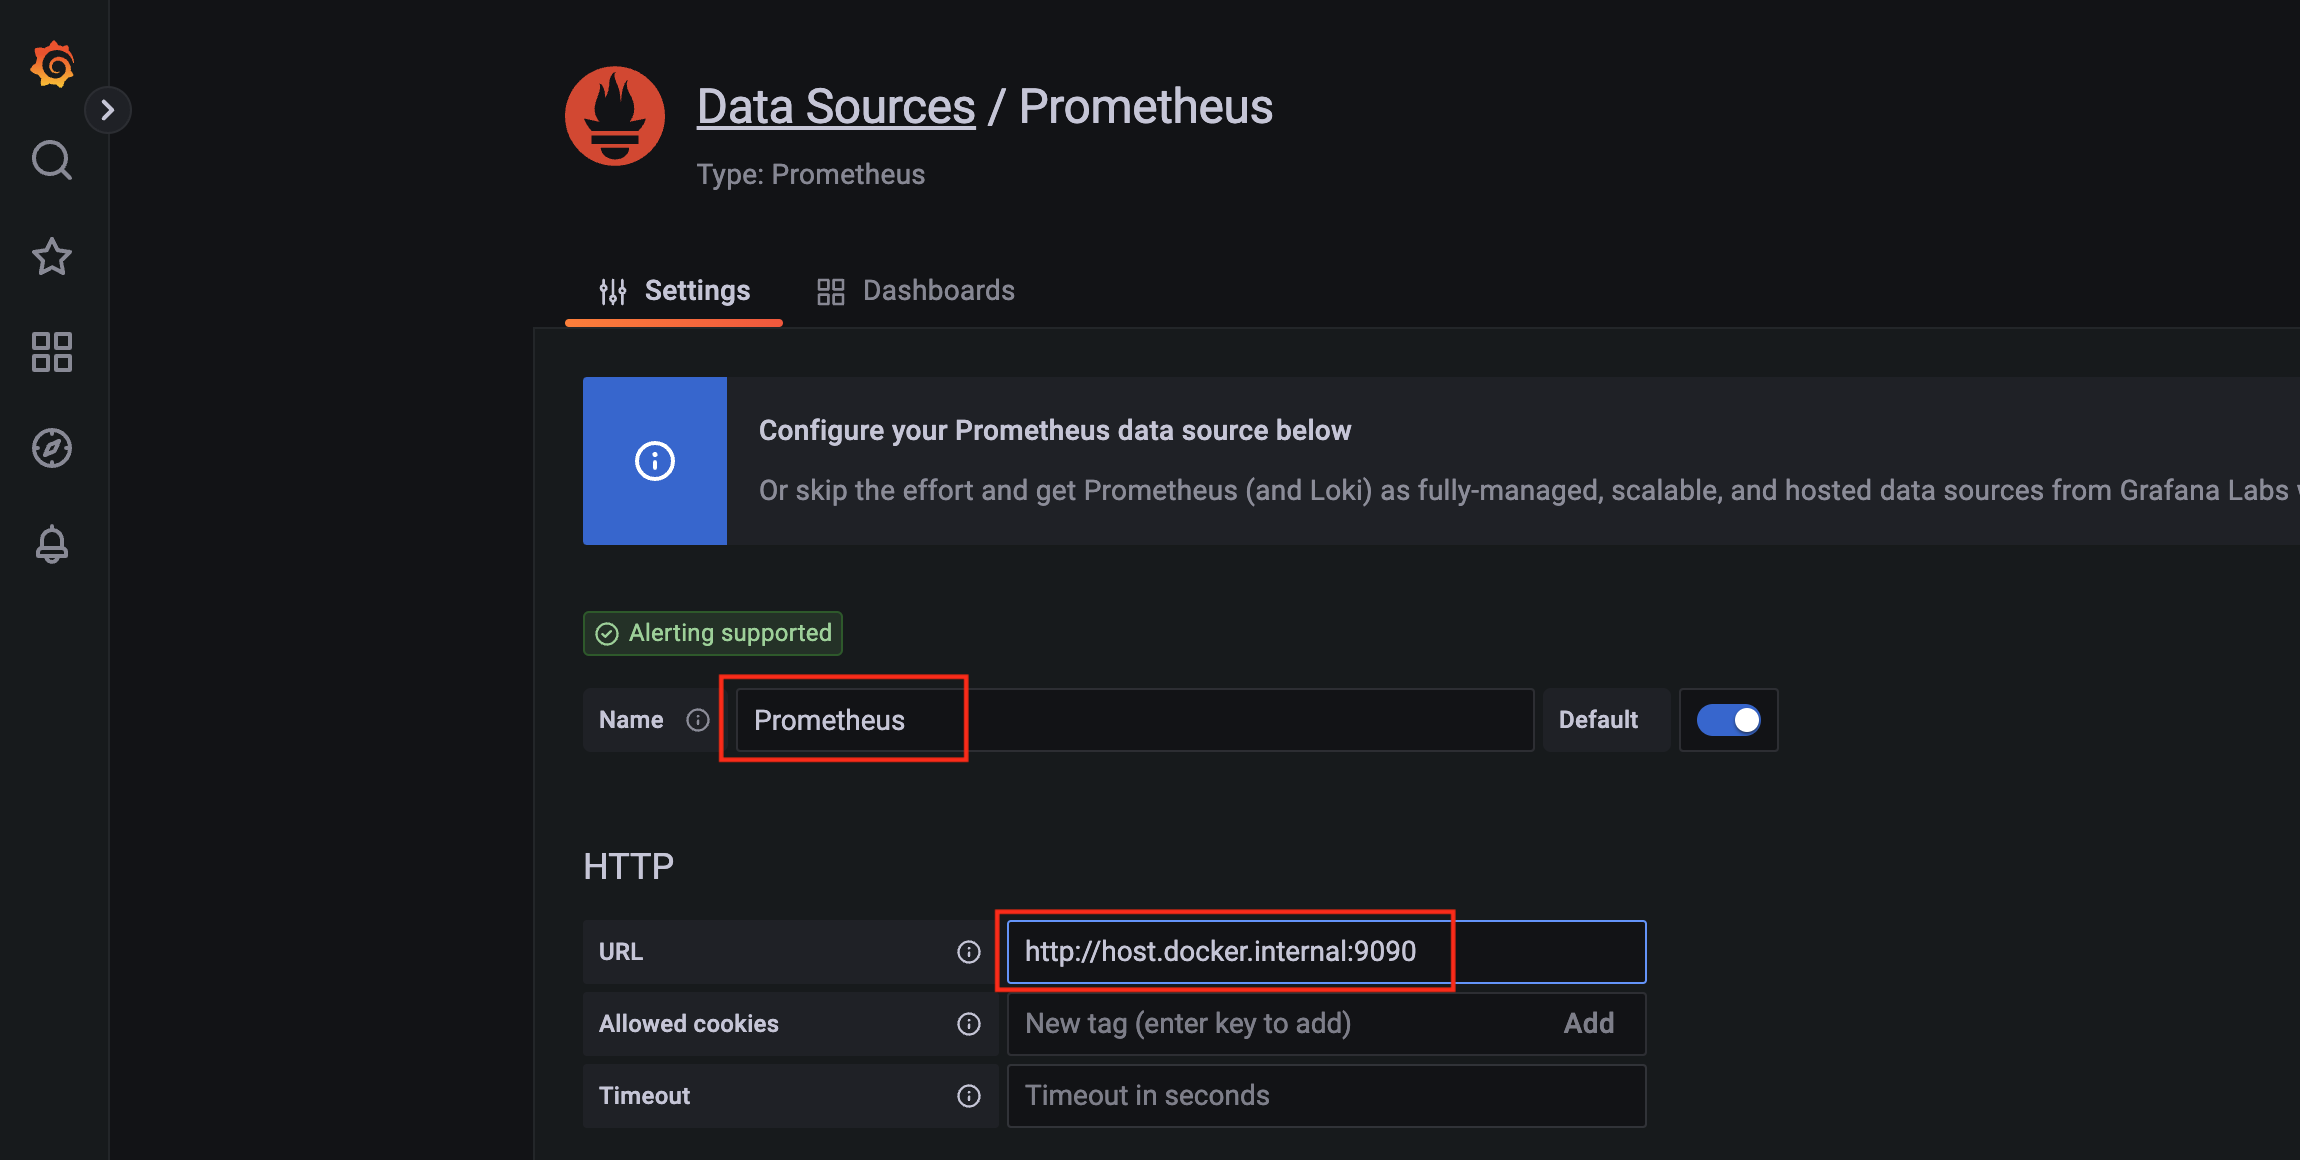
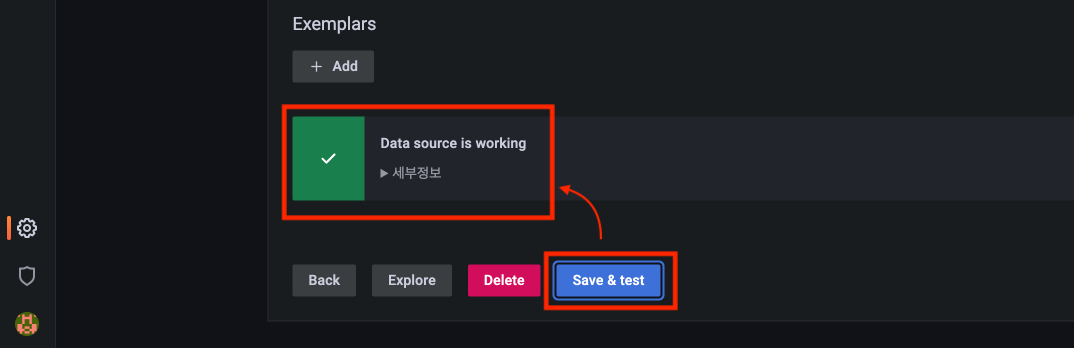
When the screen for adding a Prometheus data source appears, enter Name and URL.
Here, the implementation environment is macOS, so http://host.docker.internal:9090 is entered for the URL. Be aware that it may differ in Linux environments.
Configure and check the Grafana dashboard
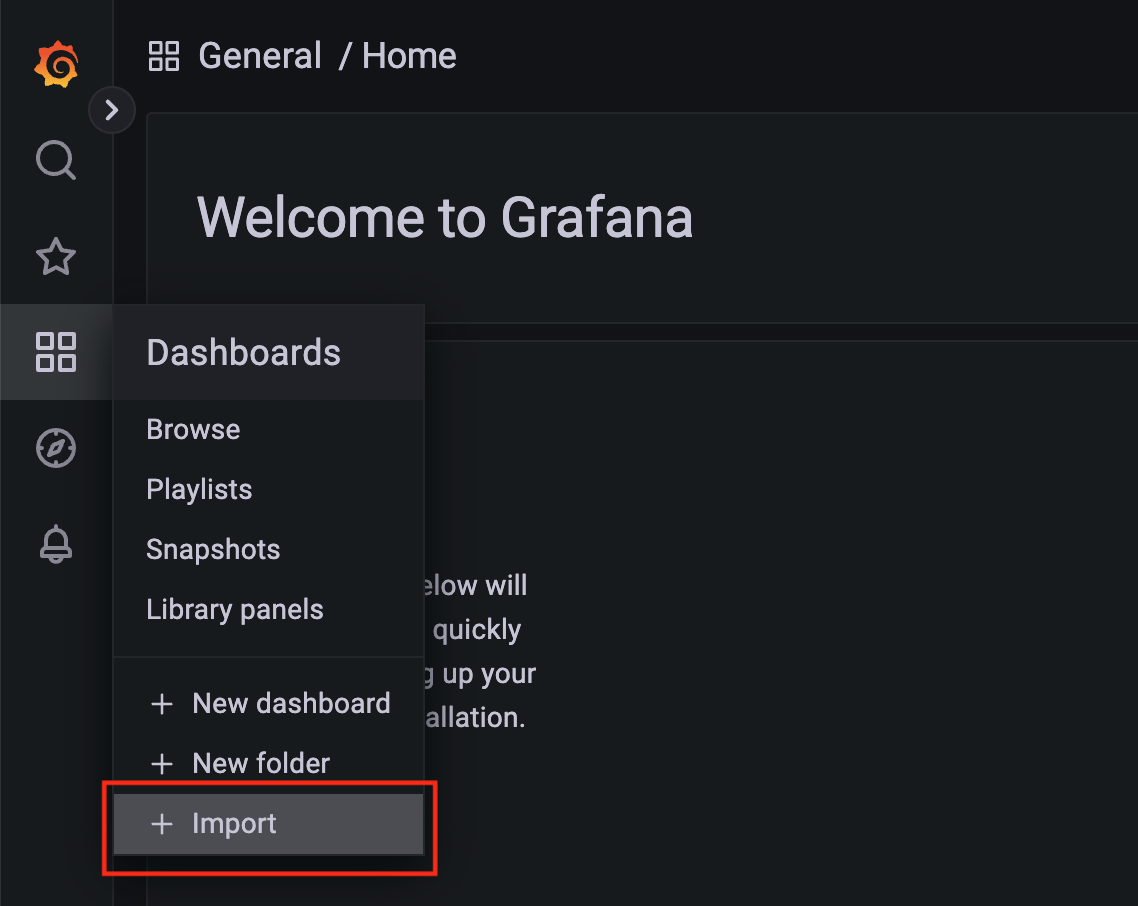
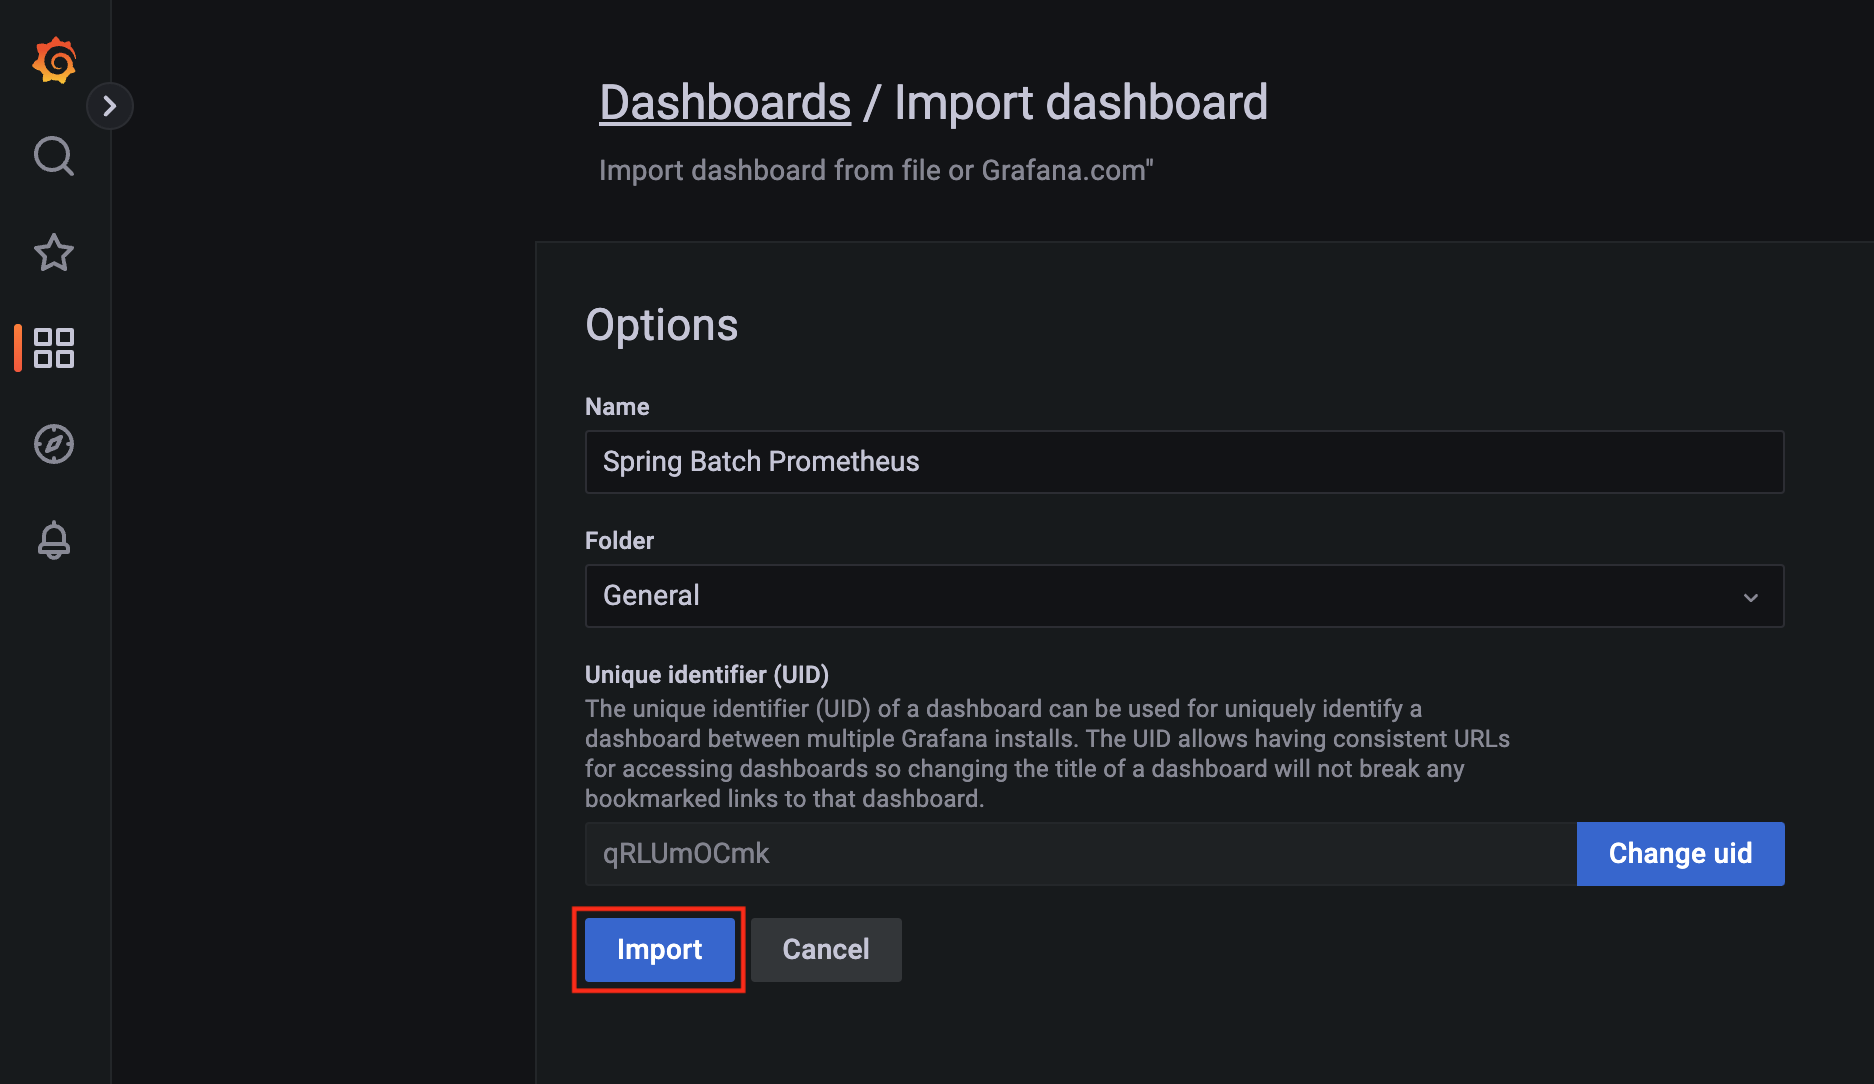
Next, add the dashboard with Import.
Select the prepared import JSON file, spring-batch-dashboard.json.
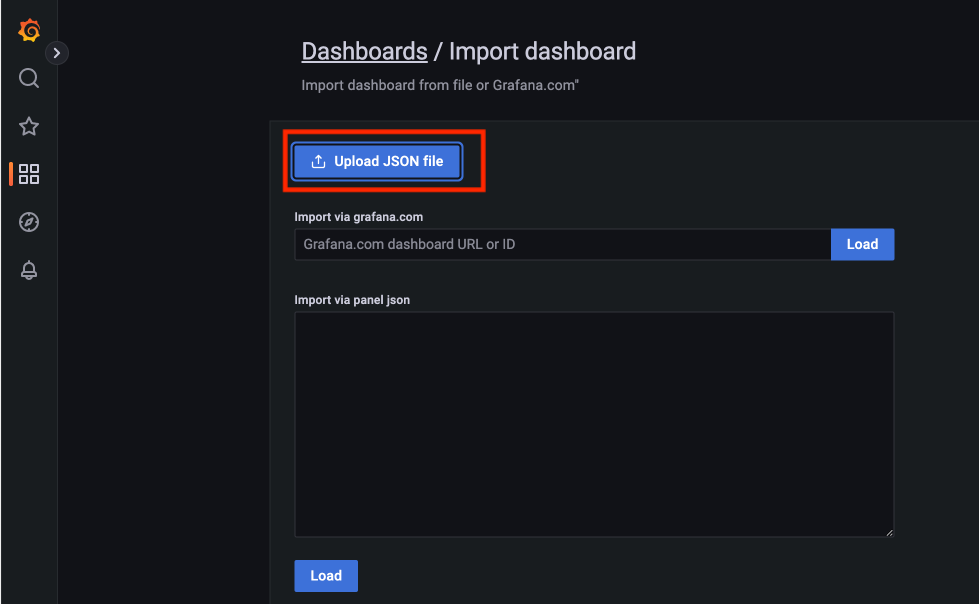
Check the contents and click Import.
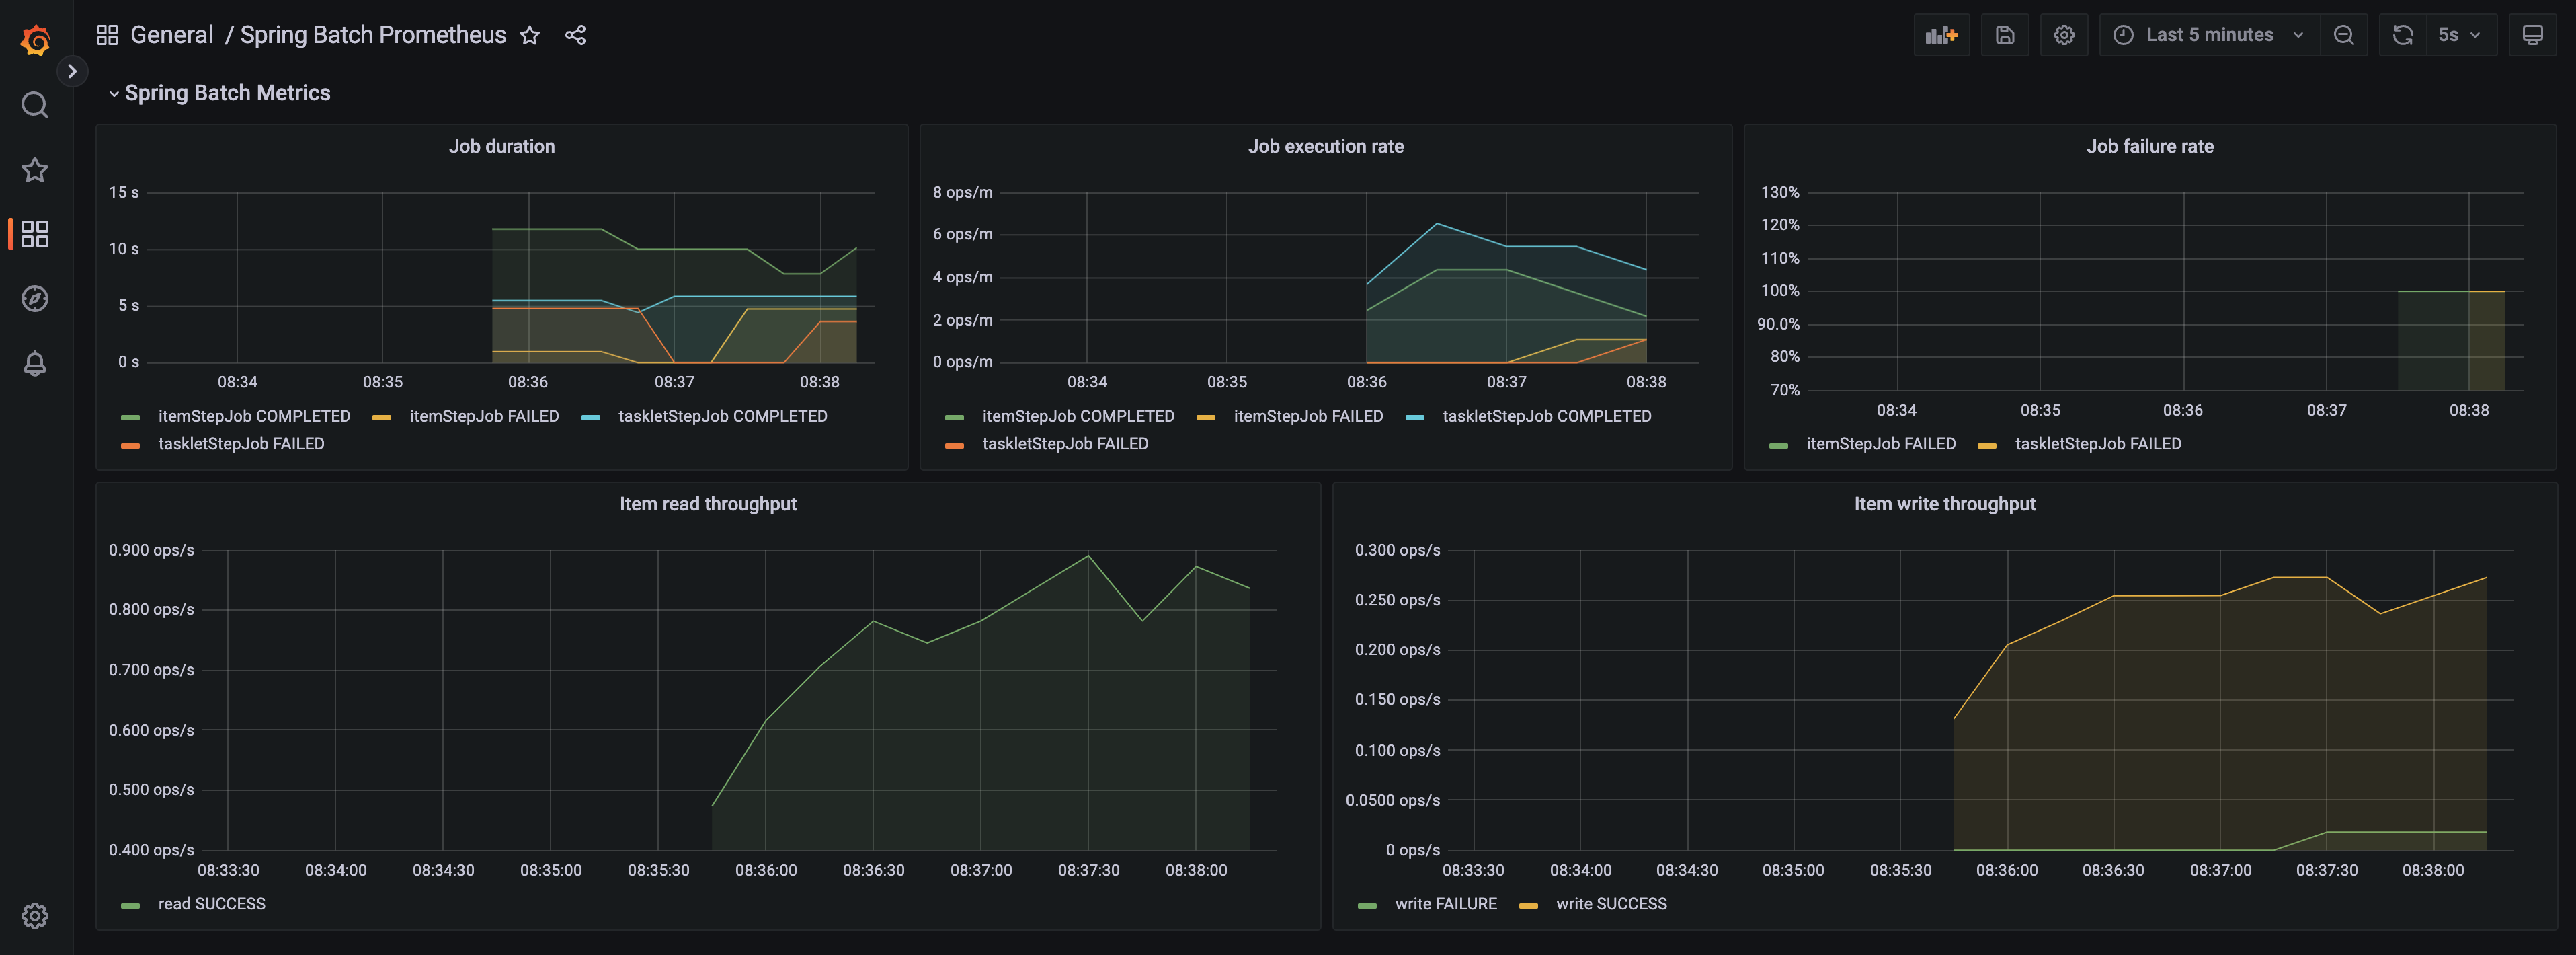
Now move to the dashboard screen and confirm that spring-batch metric information is displayed as graphs.
References
The example code above is available on GitHub.