Spring Boot default metrics
https://tomgregory.com/spring-boot-default-metrics/
This page looks at the most important default metrics provided by Spring Boot and how to use them to highlight problems in an application more effectively.
Overview of Spring Boot Actuator and Micrometer
Spring Boot Actuator provides various monitoring and management endpoints through HTTP and JMX. By integrating with the Micrometer application monitoring framework, it includes very important metrics features.
The first page of the Micrometer site says:
Micrometer provides a simple facade over the instrumentation clients for the most popular monitoring systems, allowing you to instrument your JVM-based application code without vendor lock-in. Think SLF4J, but for metrics.
Micrometer is a vendor-independent metrics facade. In other words, metrics are collected in one common way and exposed in the format required by various monitoring systems. If SLF4J exists for logging systems, Micrometer exists for monitoring systems.
Popular supported monitoring frameworks include Graphite, Prometheus, and StatsD. Here, the focus is Prometheus, a standalone service that periodically fetches metrics from an application.

Add Actuator metrics to a Spring Boot application
To configure a Spring Boot application to publish metrics in Prometheus format, follow these steps.
Include additional dependencies
To include the Spring Boot Starter Actuator module, add the following to the Gradle dependency list.
implementation 'org.springframework.boot:spring-boot-starter-actuator'
The Maven equivalent is:
<dependency>
    <groupId>org.springframework.boot</groupId>
    <artifactId>spring-boot-starter-actuator</artifactId>
</dependency>
Then add the Micrometer Registry Prometheus module, so metrics can be scraped from the application in Prometheus format.
Gradle:
implementation 'io.micrometer:micrometer-registry-prometheus:1.5.1'
Maven:
<dependency>
    <groupId>io.micrometer</groupId>
    <artifactId>micrometer-registry-prometheus</artifactId>
    <version>1.5.1</version>
</dependency>
Enable metrics in configuration
By default, almost all Spring Boot Actuator HTTP endpoints are disabled, but they can be enabled through configuration. Add the following setting to the application.properties file in the project’s src/main/resources folder.
management.endpoints.web.exposure.include=metrics,prometheus
The Actuator module has many endpoints that can be enabled, but this configuration enables only the following two.
/actuator/metrics: an endpoint that provides a JSON API for exploring metrics and viewing their values./actuator/prometheus: an endpoint that returns metrics in a custom format required for collection by Prometheus.- This is the part that will be explained continuously below.
1. Spring MVC metrics
For any web application, the default Spring MVC metrics provide an excellent starting point for monitoring inbound HTTP traffic. Whether you need to track errors, traffic volume, or request latency, these metrics help.
Inbound HTTP request duration
For each endpoint exposed by a Spring Boot application, the http_server_requests_seconds summary metric provides information about request count and request duration. It consists of two metrics exposed by the /actuator/prometheus endpoint.
# HELP http_server_requests_seconds
# TYPE http_server_requests_seconds summary
http_server_requests_seconds_count{exception="None",method="GET",outcome="SUCCESS",status="200",uri="/hello",} 12.0
http_server_requests_seconds_sum{exception="None",method="GET",outcome="SUCCESS",status="200",uri="/hello",} 0.083579374
http_server_requests_seconds_countis the total number of requests received by the application at that endpoint.http_server_requests_seconds_sumis the sum of the durations of all requests received by the application at that endpoint.
These metrics include the following tags.
| Tag | Description | Example |
|---|---|---|
exception |
Class name of the exception that occurred | None, NullPointerException |
method |
HTTP request method | GET, POST, PUT, PATCH, etc. |
outcome |
String description of the HTTP response status | SUCCESS, SERVER_ERROR |
status |
HTTP response status code | 200, 500, etc. |
uri |
Request URI | /hello |
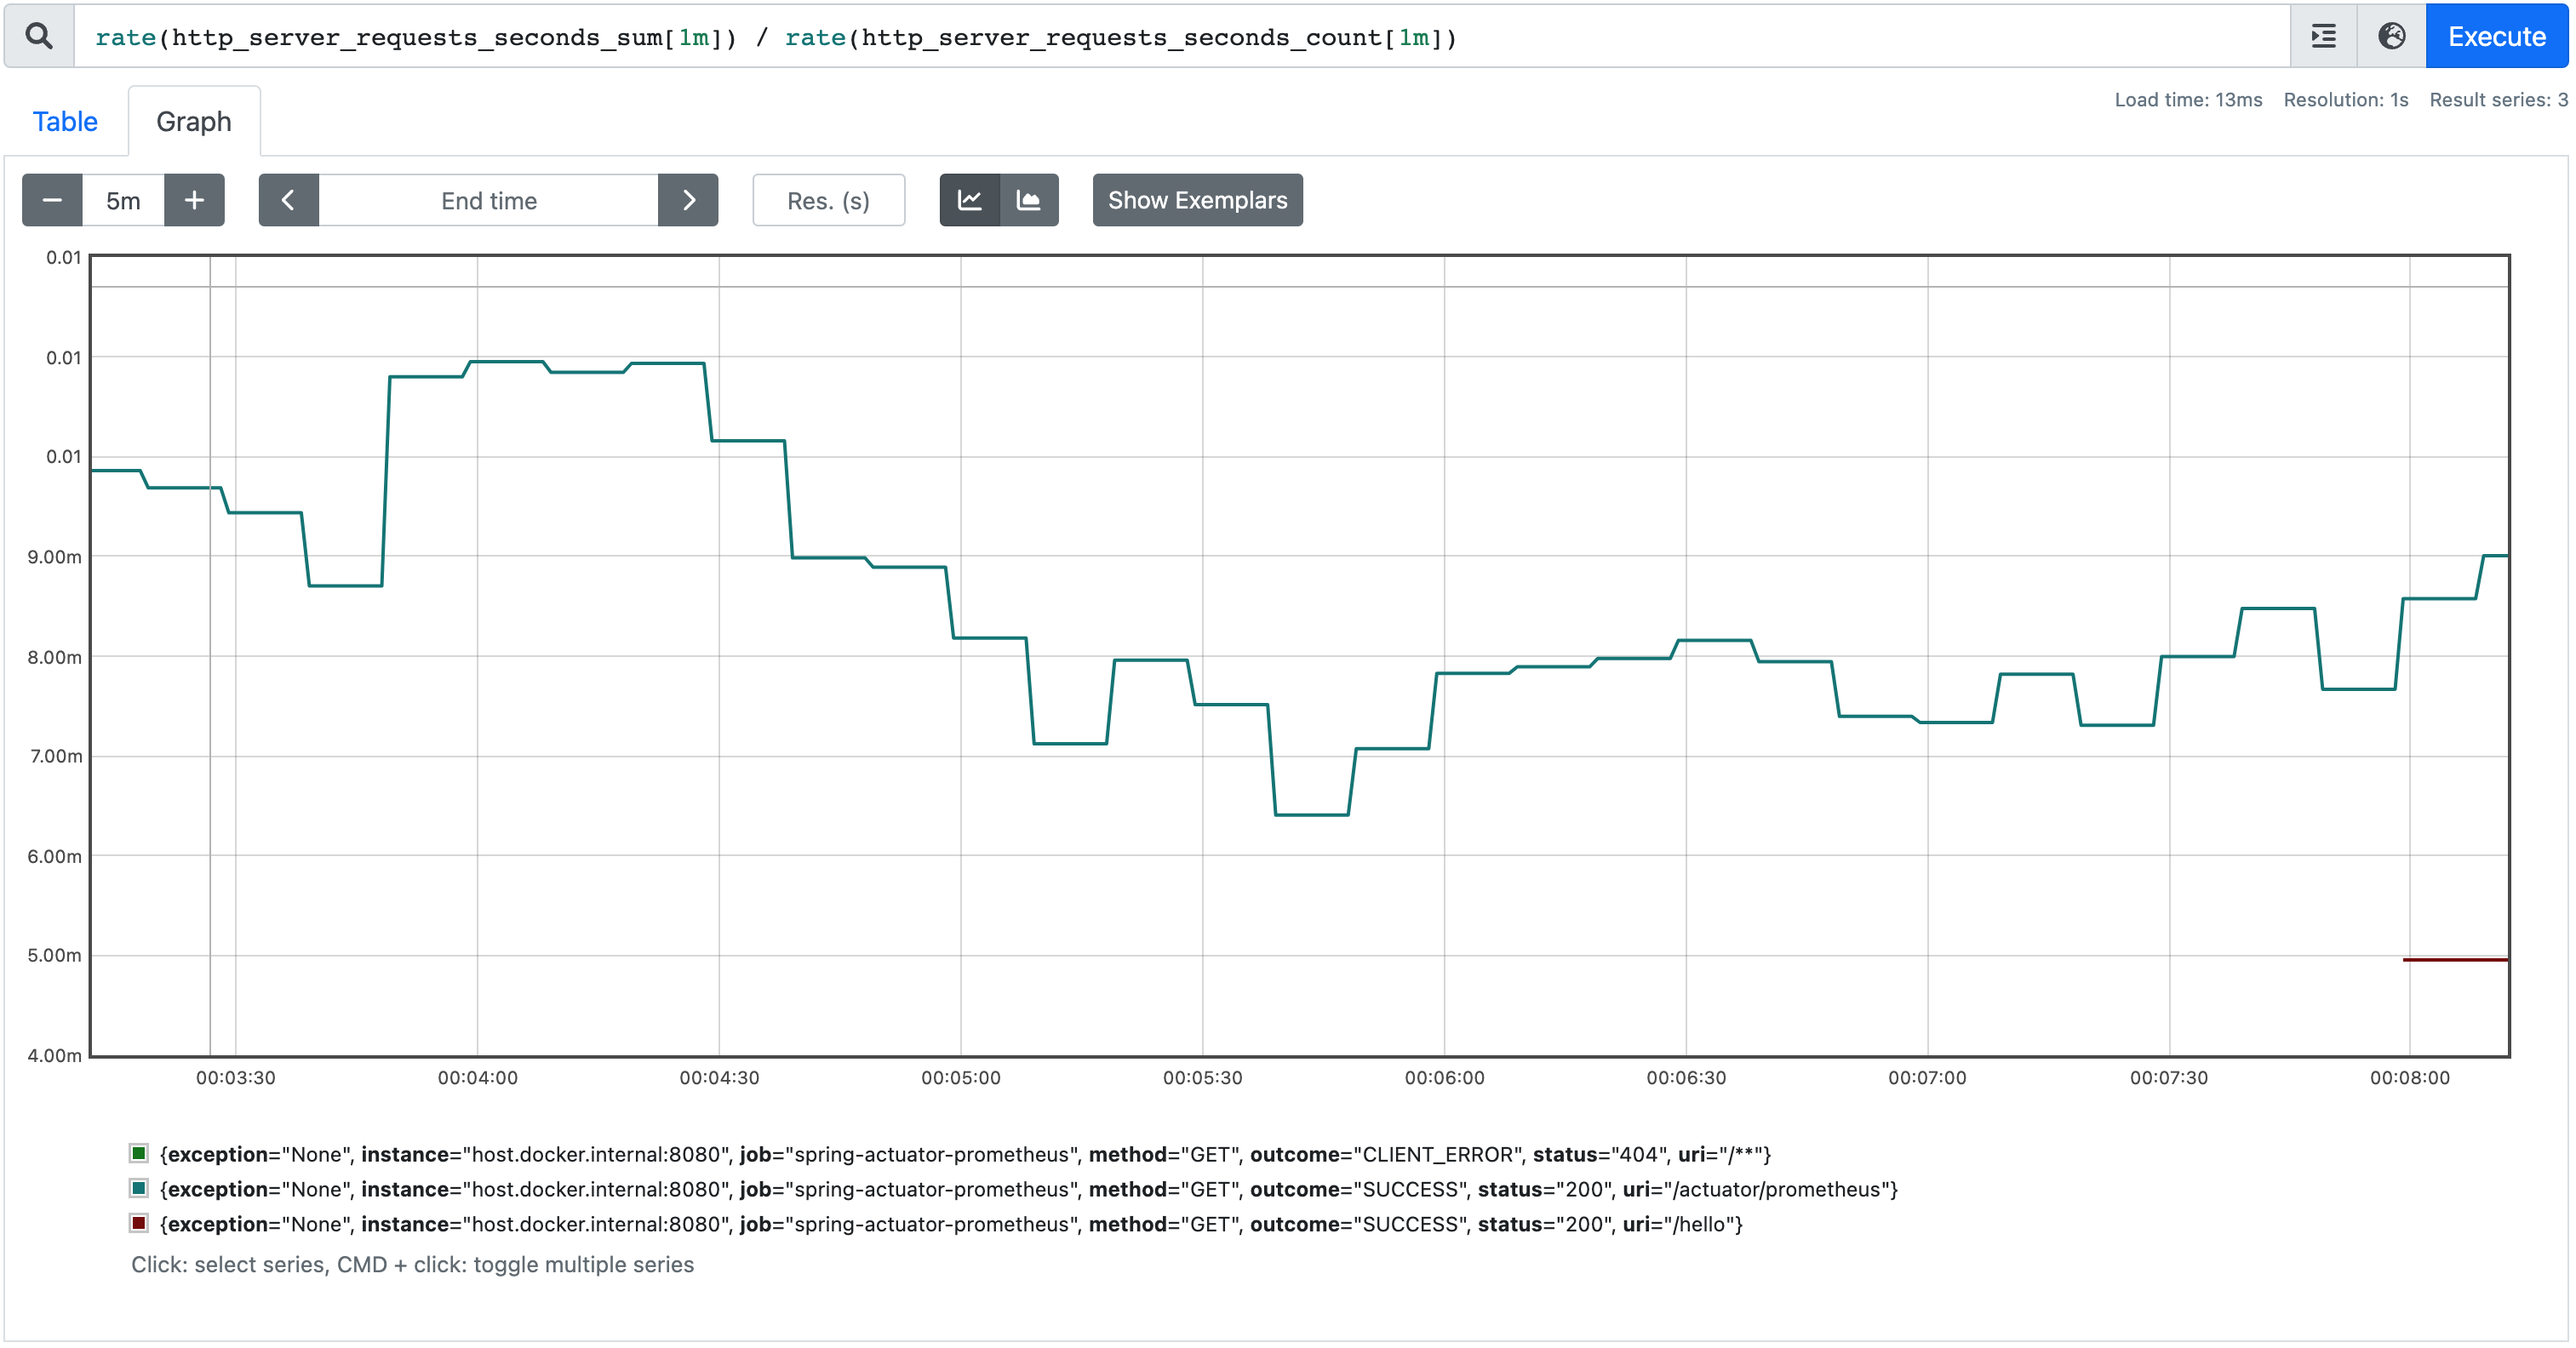
In Prometheus, you can create a simple query that provides the average inbound request duration across all tags.
rate(http_server_requests_seconds_sum[1m]) / rate(http_server_requests_seconds_count[1m])
Inbound HTTP request quantiles and percentiles
Spring MVC metrics can also calculate quantiles and percentiles, which can be useful when evaluating how slow API request durations are while ignoring the slowest requests.
For example, the 95th percentile is the value below which 95% of observed values fall and above which 5% fall. In other words, it provides the slowest request duration seen by 95% of requests.
To enable quantiles, add an additional configuration property to application.properties, replacing it with the quantiles of interest, which are not percentiles despite the name.
management.metrics.web.server.request.autotime.percentiles=<comma-separated list of quantiles>
If the property is configured as 0.95, the following metric is generated at /actuator/prometheus.
http_server_requests_seconds{exception="None",method="GET",outcome="SUCCESS",status="200",uri="/hello",quantile="0.95",} 0.023068672
The tags used with this metric are the same as above, but now there is also a quantile tag that can be used to query the metric.
The query http_server_requests_seconds{quantile="0.95"} generates a graph in Prometheus.
Maximum inbound HTTP request duration
For each endpoint exposed by a Spring Boot application, the http_server_requests_seconds_max gauge metric provides the maximum duration for each inbound HTTP request type.
# HELP http_server_requests_seconds_max Duration of HTTP server request handling
# TYPE http_server_requests_seconds_max gauge
http_server_requests_seconds_max{exception="None",method="GET",outcome="SUCCESS",status="200",uri="/hello",} 0.005831
http_server_requests_seconds_maxis the maximum request duration during a period. When a new time window starts, the value is reset to 0. The default time window is two minutes.
The tags used with this metric are the same as above.
This graph is generated in Prometheus from a regular http_server_requests_seconds_max query.
All metrics described in this document can be started and run immediately using the accompanying GitHub repository. It includes a Spring Boot application that generates metrics and a Prometheus instance where queries can be executed.
2. HTTP client RestTemplate and WebClient outbound request metrics
If you perform outbound HTTP requests using the RestTemplate or WebClient classes, request metrics similar to inbound HTTP requests can be used. For these metrics to work, the HTTP client must be created using the injected RestTemplateBuilder or WebClient.Builder class.
Outbound HTTP request duration
Each outbound endpoint gets the http_client_requests_seconds metric. It consists of two metrics exposed by the /actuator/prometheus endpoint.
# HELP http_client_requests_seconds Timer of RestTemplate operation
# TYPE http_client_requests_seconds summary
http_client_requests_seconds_count{clientName="google.com",method="GET",outcome="SUCCESS",status="200",uri="/https://google.com",} 3.0
http_client_requests_seconds_sum{clientName="google.com",method="GET",outcome="SUCCESS",status="200",uri="/https://google.com",} 0.465022459
http_client_requests_seconds_countis the total number of requests the application made to this endpoint.http_client_requests_seconds_sumis the sum of the durations of all requests the application made to this endpoint.
These metrics also include the following tags.
| Tag | Description |
|---|---|
clientName |
Name of the endpoint being called, using the host of the URI |
exception |
Class name of the exception that occurred |
method |
HTTP request method |
outcome |
String description of the HTTP response status |
status |
HTTP response status code |
uri |
Request URI |
In Prometheus, you can create a simple query that provides average outbound request duration over time.
rate(http_client_requests_seconds_sum[1m]) / rate(http_client_requests_seconds_count[1m])
Maximum outbound HTTP request duration
Each outbound endpoint gets the http_client_requests_seconds_max gauge metric, which provides the maximum duration of each outbound HTTP request type.
# HELP http_client_requests_seconds_max Timer of RestTemplate operation
# TYPE http_client_requests_seconds_max gauge
http_client_requests_seconds_max{clientName="google.com",method="GET",outcome="SUCCESS",status="200",uri="/https://google.com",} 0.205564498
http_client_requests_seconds_maxis the maximum request duration during a period. When a new time window starts, the value is reset to 0. The default time window is two minutes.
The tags used with this metric are the same as in “Outbound HTTP request duration” above.
3. JVM metrics
Micrometer includes three types of metrics that help monitor what is happening in the JVM (Java Virtual Machine).
JVM memory metrics
For each memory area, you can check the amount of memory used with jvm_memory_used_bytes and the available memory with jvm_memory_max_bytes.
# HELP jvm_memory_used_bytes The amount of used memory
# TYPE jvm_memory_used_bytes gauge
jvm_memory_used_bytes{area="heap",id="G1 Survivor Space",} 8388608.0
jvm_memory_used_bytes{area="heap",id="G1 Old Gen",} 3938936.0
jvm_memory_used_bytes{area="nonheap",id="Metaspace",} 4.2306152E7

...

# HELP jvm_memory_max_bytes The maximum amount of memory in bytes that can be used for memory management
# TYPE jvm_memory_max_bytes gauge
jvm_memory_max_bytes{area="heap",id="G1 Survivor Space",} -1.0
jvm_memory_max_bytes{area="heap",id="G1 Old Gen",} 8.589934592E9
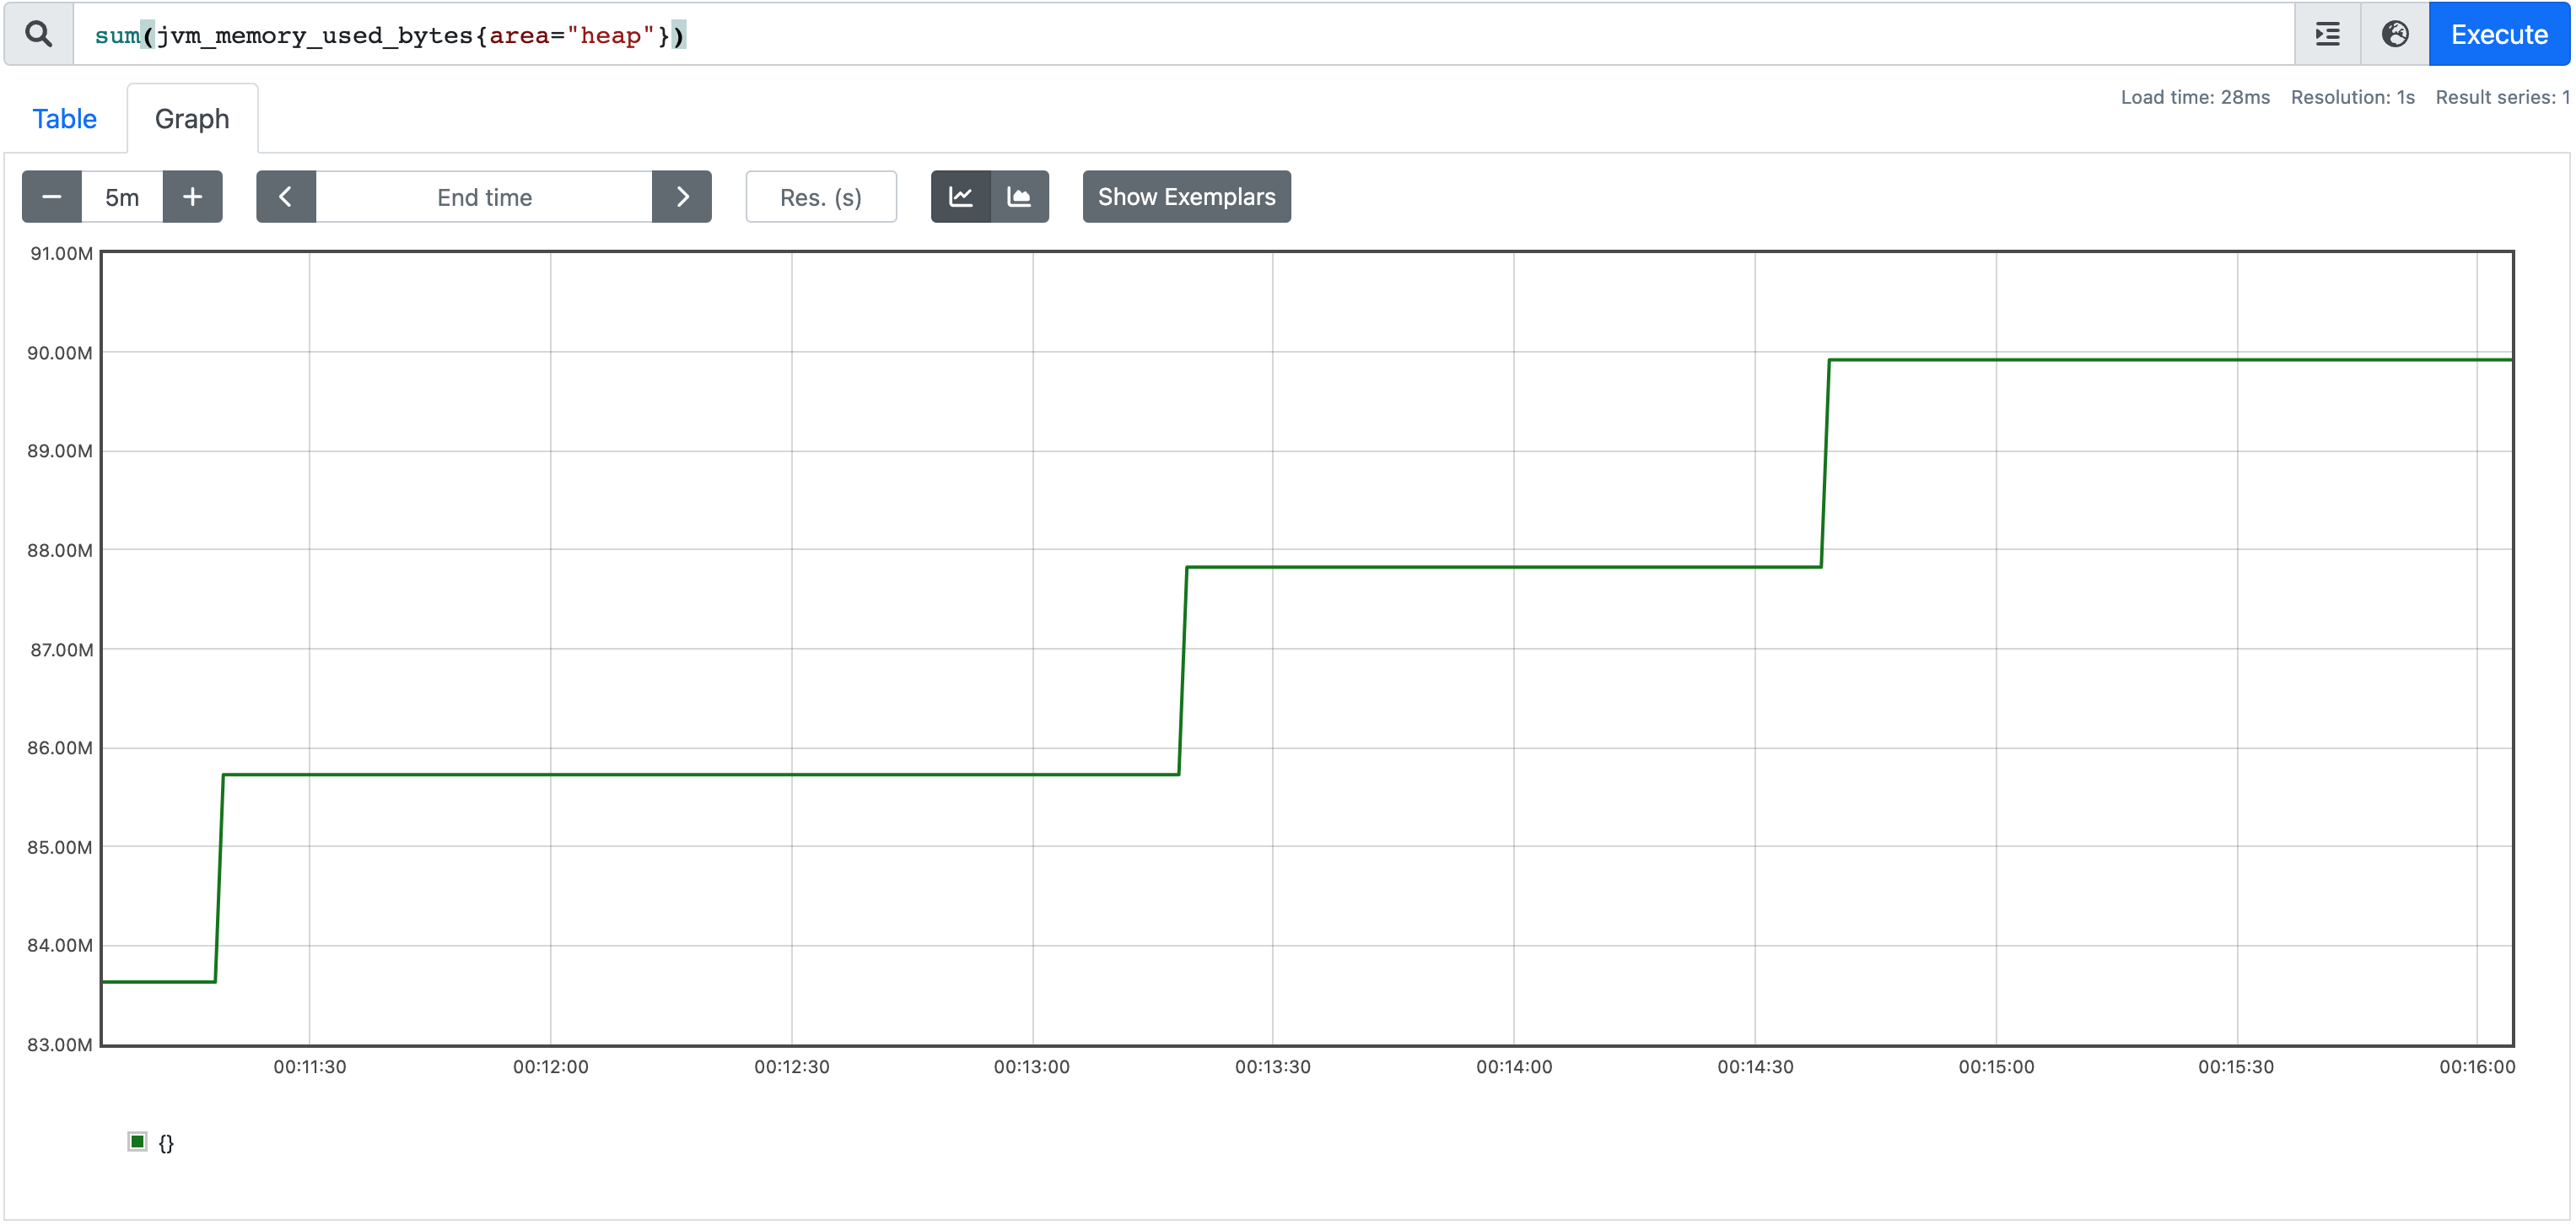
There is a lot of data here, but for example, you can display the total amount of used heap memory in Prometheus with the following query.
sum(jvm_memory_used_bytes{area="heap"})
This uses the Prometheus sum function to add the memory used in all heap memory areas visible in the id tag above, such as G1 Survivor Space, G1 Old Gen, and G1 Eden Space.
JVM garbage collection metrics
There are many garbage collection metrics available to gain deep insight into how the JVM manages memory. They can largely be divided into the following areas.
Pause time
The jvm_gc_pause_seconds and jvm_gc_pause_seconds_max metrics provide information about the time spent in garbage collection.
# HELP jvm_gc_pause_seconds Time spent in GC pause
# TYPE jvm_gc_pause_seconds summary
jvm_gc_pause_seconds_count{action="end of minor GC",cause="Metadata GC Threshold",} 1.0
jvm_gc_pause_seconds_sum{action="end of minor GC",cause="Metadata GC Threshold",} 0.005
# HELP jvm_gc_pause_seconds_max Time spent in GC pause
# TYPE jvm_gc_pause_seconds_max gauge
jvm_gc_pause_seconds_max{action="end of minor GC",cause="Metadata GC Threshold",} 0.0
Memory pool size increase
The jvm_gc_memory_allocated_bytes_total metric tells you about increases in the size of the young-generation memory pool, while jvm_gc_memory_promoted_bytes_total is for the old generation.
# HELP jvm_gc_memory_allocated_bytes_total Incremented for an increase in the size of the young generation memory pool after one GC to before the next
# TYPE jvm_gc_memory_allocated_bytes_total counter
jvm_gc_memory_allocated_bytes_total 2.66338304E8
# HELP jvm_gc_memory_promoted_bytes_total Count of positive increases in the size of the old generation memory pool before GC to after GC
# TYPE jvm_gc_memory_promoted_bytes_total counter
jvm_gc_memory_promoted_bytes_total 1.4841448E7
Live old-generation pool size
The jvm_gc_live_data_size_bytes metric tells you the old-generation pool size. jvm_gc_max_data_size_bytes tells you the maximum size that can be allocated to the old-generation pool.
# HELP jvm_gc_live_data_size_bytes Size of old generation memory pool after a full GC
# TYPE jvm_gc_live_data_size_bytes gauge
jvm_gc_live_data_size_bytes 9039328.0
# HELP jvm_gc_max_data_size_bytes Max size of old generation memory pool
# TYPE jvm_gc_max_data_size_bytes gauge
jvm_gc_max_data_size_bytes 5.22190848E8
JVM thread metrics
These metrics let you check the threads in the JVM.
# HELP jvm_threads_states_threads The current number of threads having NEW state
# TYPE jvm_threads_states_threads gauge
jvm_threads_states_threads{state="runnable",} 7.0
jvm_threads_states_threads{state="blocked",} 0.0
jvm_threads_states_threads{state="waiting",} 11.0
jvm_threads_states_threads{state="timed-waiting",} 3.0
jvm_threads_states_threads{state="new",} 0.0
jvm_threads_states_threads{state="terminated",} 0.0
# HELP jvm_threads_live_threads The current number of live threads including both daemon and non-daemon threads
# TYPE jvm_threads_live_threads gauge
jvm_threads_live_threads 21.0
# HELP jvm_threads_daemon_threads The current number of live daemon threads
# TYPE jvm_threads_daemon_threads gauge
jvm_threads_daemon_threads 17.0
# HELP jvm_threads_peak_threads The peak live thread count since the Java virtual machine started or peak was reset
# TYPE jvm_threads_peak_threads gauge
jvm_threads_peak_threads 23.0
jvm_threads_states_threadsshows the number of threads in each thread state.jvm_threads_live_threadsshows the total number of live threads, including daemon and non-daemon threads.jvm_threads_daemon_threadsshows the total number of daemon threads.jvm_threads_peak_threadsshows the maximum total number of threads since the JVM started.
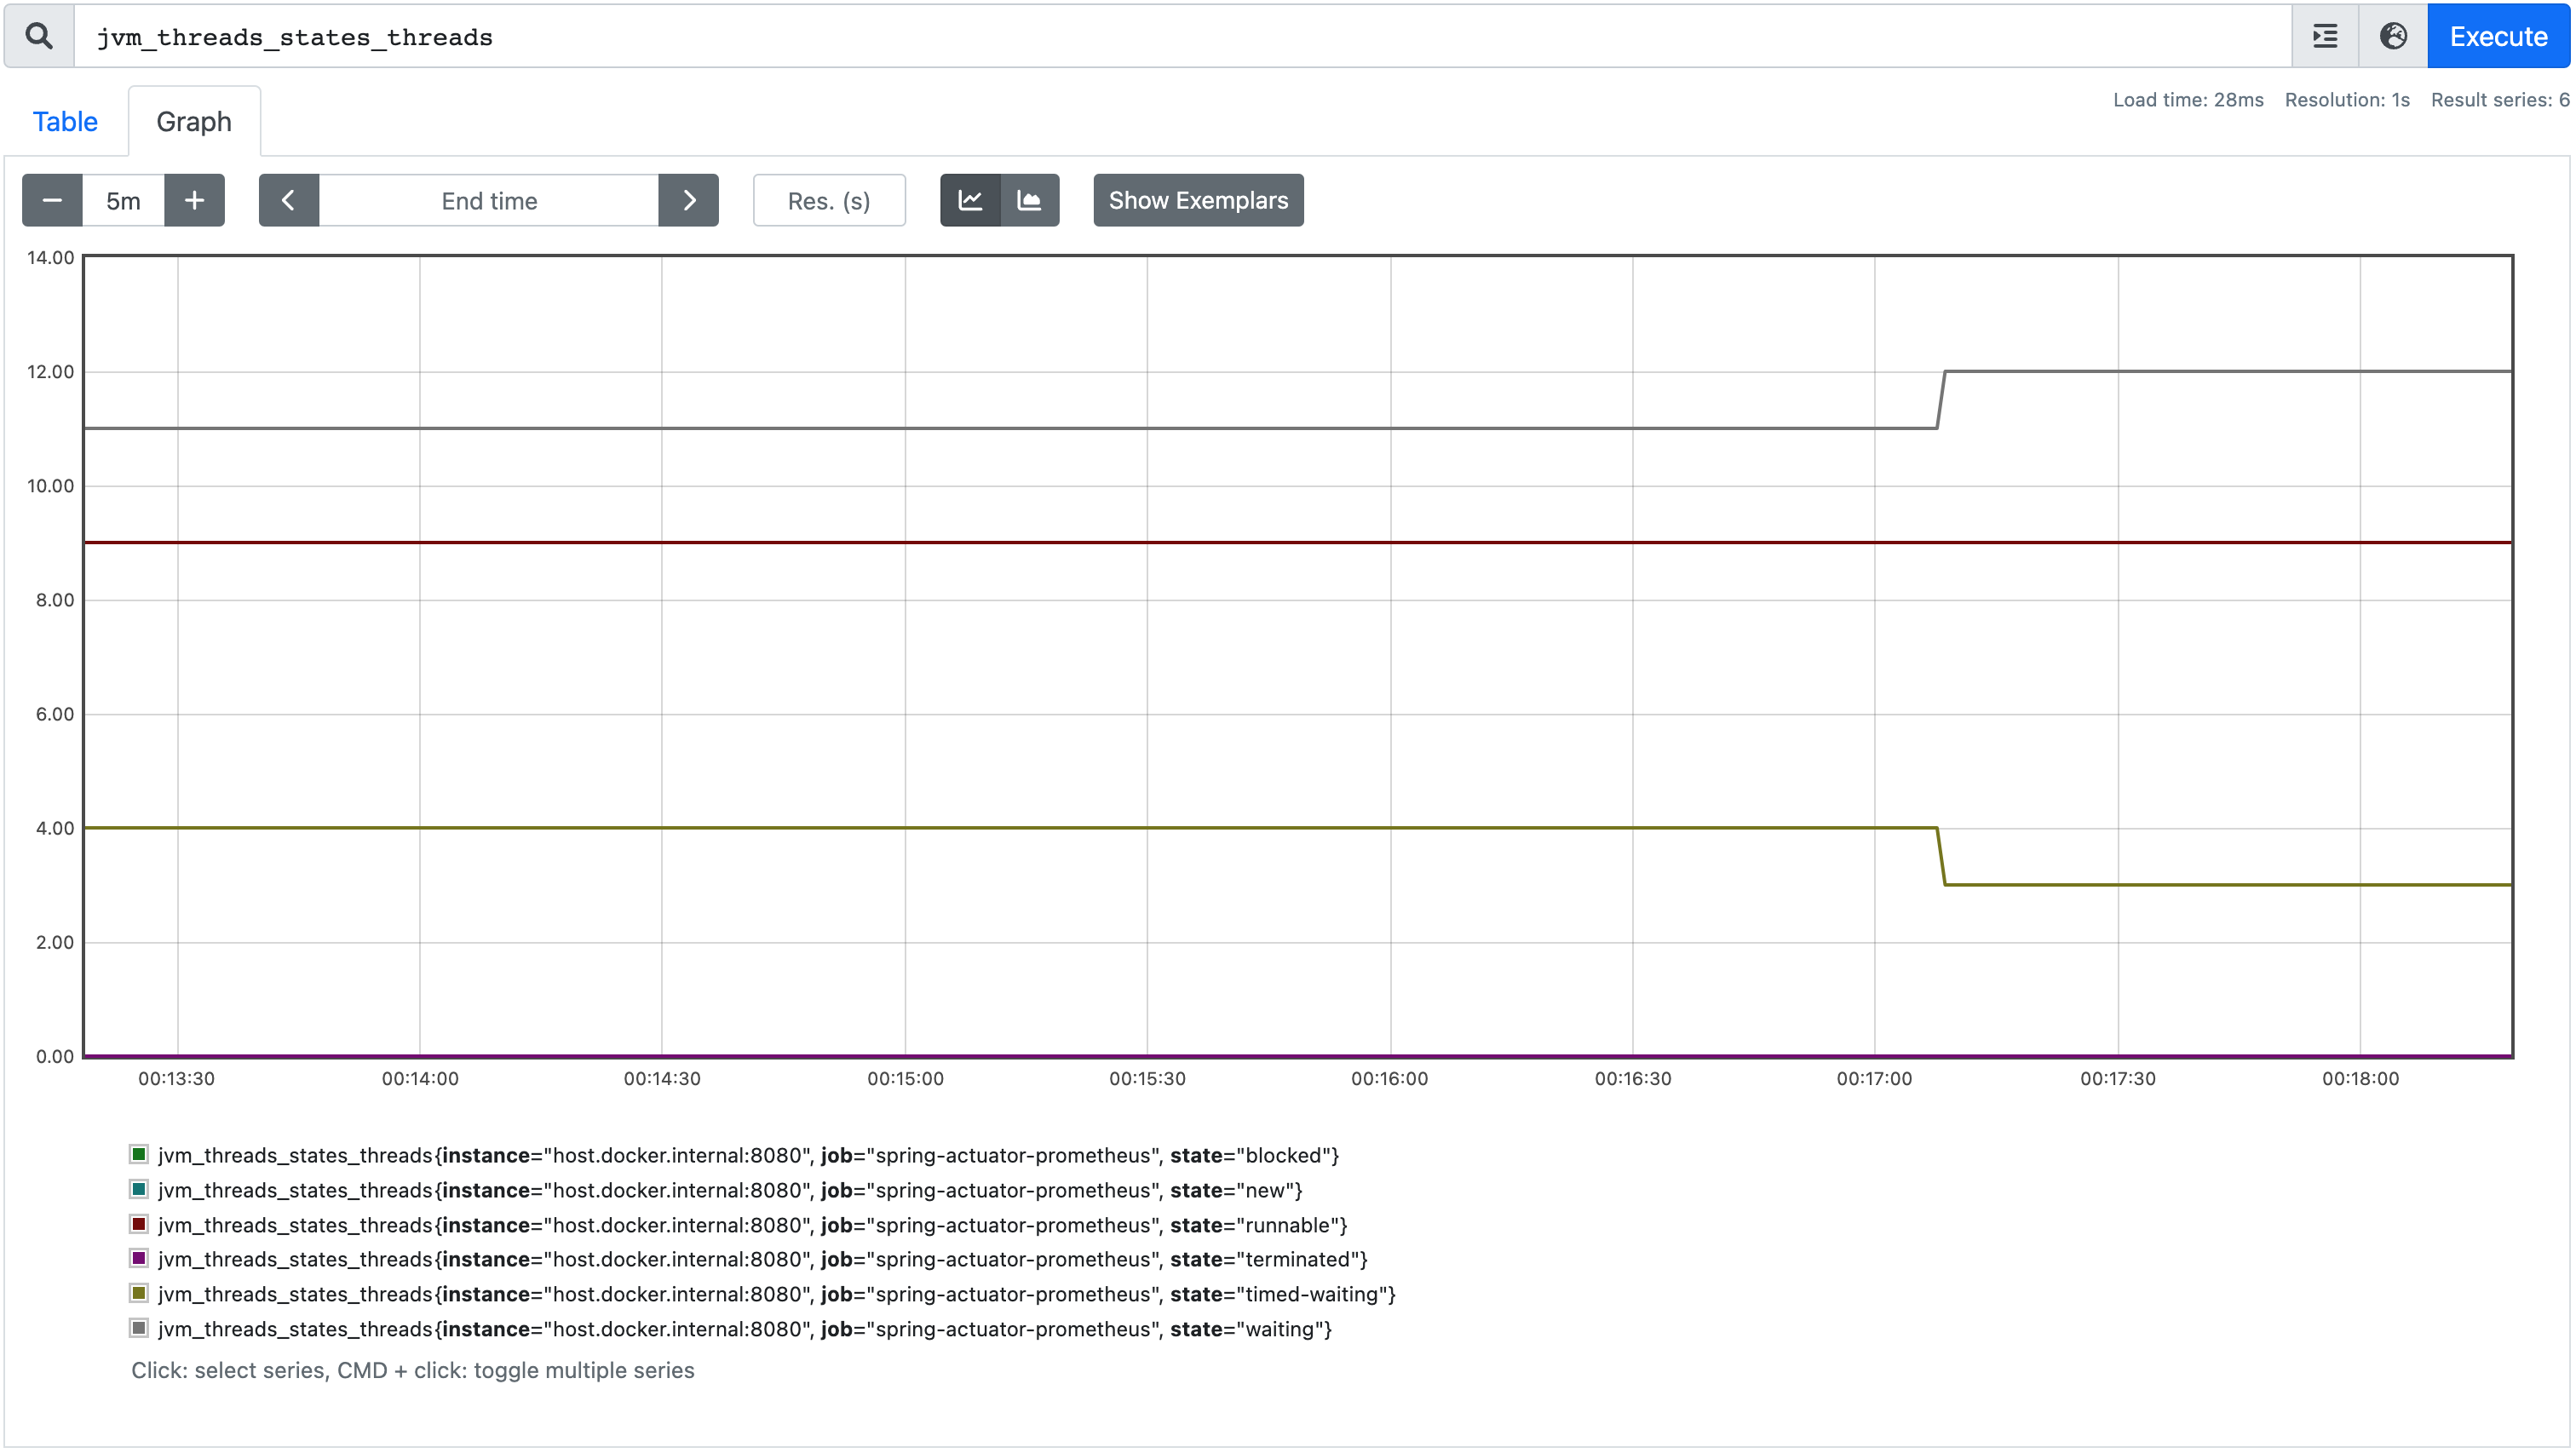
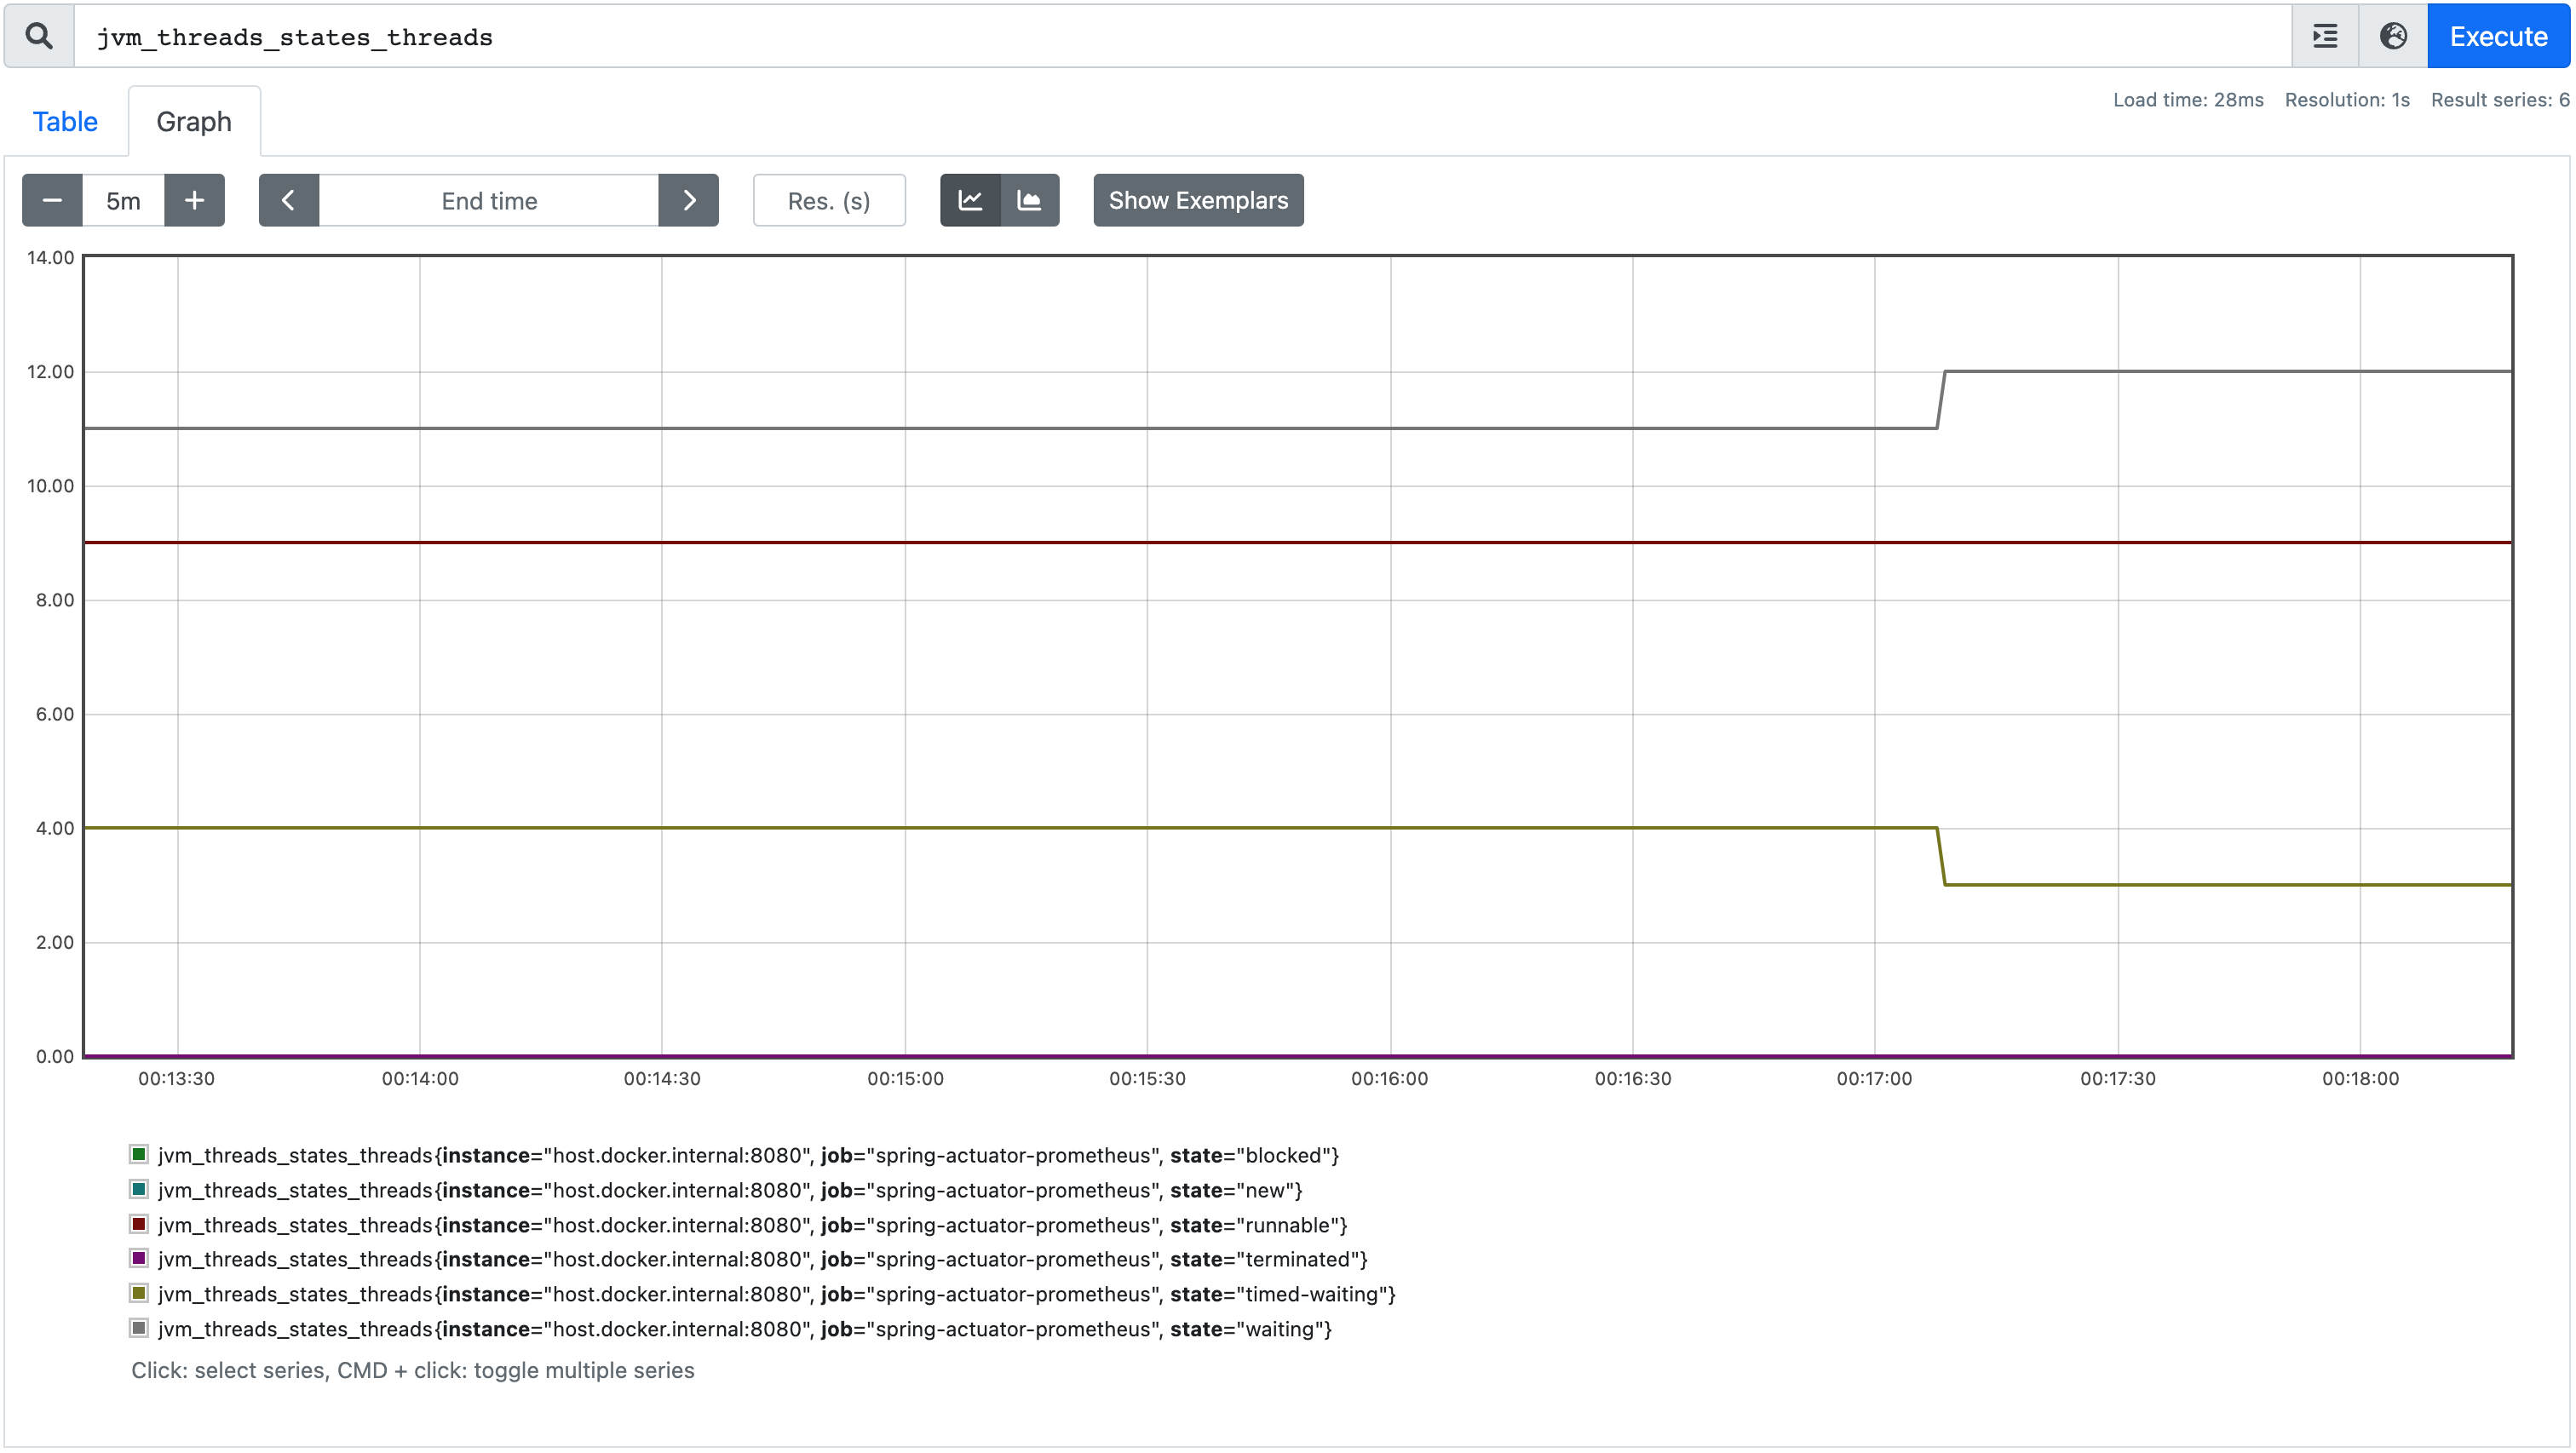
If you run jvm_threads_states_threads in Prometheus, you can see all thread states in the graph.