Spring Boot default-metrics
https://tomgregory.com/spring-boot-default-metrics/
여기에서는 Spring Boot에서 제공되는 가장 중요한 기본 메트릭과 이를 사용하여 애플리케이션 내의 문제를 보다 효과적으로 강조하는 방법을 살펴보겠다.
스프링 부트 액추에이터 및 마이크로미터 개요
Spring Boot Actuator는 HTTP 및 JMX를 통해 다양한 모니터링 및 관리 엔드포인트를 제공한다. Micrometer 애플리케이션 모니터링 프레임워크와 통합하여 매우 중요한 메트릭 기능이 포함된다.
Micrometer 사이트 첫 페이지에서는 아래와 같은 내용 있다.
Micrometer provides a simple facade over the instrumentation clients for the most popular monitoring systems, allowing you to instrument your JVM-based application code without vendor lock-in. Think SLF4J, but for metrics.
Micrometer는 벤더에 의존하지 않는 메트릭 파사드(metrics facade)이다. 즉, 하나의 공통된 방법으로 메트릭을 수집되고, 다양한 모니터링 시스템에서 요구하는 형식으로 노출된다. 로깅 관련된 시스템에서는 SLF4J가 있다면, 모니터링(metric) 시스템에서는 Micrometer가 있는 것이다.
지원되는 인기 있는 모니터링 프레임워크에는 Graphite, Prometheus, StatsD가 있다. 여기서는 애플리케이션에서 주기적으로 메트릭을 가져오는 독립형 서비스인 Prometeus에 중점을 맞출 것이다.

Spring Boot 애플리케이션에 액추에이터 메트릭 추가
Prometheus 형식으로 메트릭을 게시하도록 Spring Boot 애플리케이션을 구성하려면 다음과 같은 단계를 따르면 된다.
추가 종속성 포함
Spring Boot Starter Actuator 모듈을 포함하려면 Gradle 종속성 목록에 다음을 추가한다.
implementation 'org.springframework.boot:spring-boot-starter-actuator'
다음은 Maven에서 이에 해당하는 내용이다.
<dependency>
    <groupId>org.springframework.boot</groupId>
    <artifactId>spring-boot-starter-actuator</artifactId>
</dependency>
그리고, Micrometer Registry Prometheus 모듈을 추가 하여 애플리케이션에서 Prometheus 형식으로 메트릭을 스크랩할 수 있다.
Gradle:
implementation 'io.micrometer:micrometer-registry-prometheus:1.5.1'
Maven:
<dependency>
    <groupId>io.micrometer</groupId>
    <artifactId>micrometer-registry-prometheus</artifactId>
    <version>1.5.1</version>
</dependency>
구성에서 메트릭 활성화 설정
기본적으로 거의 모든 Spring Boot Actuator HTTP 엔드포인트는 비활성화되어 있지만 구성을 통해 활성화할 수 있다. 프로젝트의 src/main/resources 폴더에 있는 application.properties 파일에 다음과 같은 설정을 추가한다.
management.endpoints.web.exposure.include=metrics,prometheus
액추에이터 모듈에는 활성화할 수 있는 엔드포인트가 많지만, 이 구성에서는 다음 두 가지만 활성화하였다.
/actuator/metrics메트릭을 탐색하고 해당 값을 보기 위한 JSON API를 제공하는 엔드 포인트이다./actuator/prometheusPrometheus로 수집하는데 필요한 사용자 지정 형식으로 메트릭을 반환하는 엔드포인트이다.- 이 부분이 앞으로 계속 설명하려는 내용이다.
1. 스프링 MVC 메트릭
모든 웹 애플리케이션의 경우 기본 Spring MVC 메트릭은 인바운드 HTTP 트래픽을 모니터링하기 위한 훌륭한 시작 포인트를 제공한다. 오류, 트래픽 볼륨 또는 요청 지연 시간을 추적해야 하는지 여부와 관계없이 이러한 메트릭을 통해 확인할 수 있다.
인바운드 HTTP 요청 기간
Spring Boot 애플리케이션에서 노출되는 각 엔드포인드에 대해 요청 수 및 요청 기간에 대한 정보를 제공 하는 http_server_requests_seconds 요약 메트릭을 얻는다. 이는 /actuator/prometheus 엔드포인트에 노출된 두 개의 메트릭으로 구성된다.
Spring Boot 애플리케이션이 공개되는 각 엔드포인트에 대해 요청 수와 요청 기간에 대한 정보를 http_server_requests_seconds으로 요약된 메트릭을 제공 받는다. 이는 /actuator/promeetus 엔드포인트에 노출된 두 가지 메트릭으로 구성된다:
# HELP http_server_requests_seconds
# TYPE http_server_requests_seconds summary
http_server_requests_seconds_count{exception="None",method="GET",outcome="SUCCESS",status="200",uri="/hello",} 12.0
http_server_requests_seconds_sum{exception="None",method="GET",outcome="SUCCESS",status="200",uri="/hello",} 0.083579374
http_server_requests_seconds_count는 애플리케이션이 해당 엔드포인트에서 받은 총 요청 수이다.http_server_requests_seconds_sum은 애플리케이션이 해당 엔드포인트에서 받은 모든 요청 기간의 합계이다.
이러한 메트릭에는 다음 태그가 포함되어 있다.
| Tag | 설명 | 예시 |
|---|---|---|
exception |
발생한 예외의 클래스 이름 | None, NullPointerException |
method |
HTTP 요청 방법 | GET, POST, PUT, PATCH 등 |
outcome |
HTTP 응답 상태에 대한 문자열 설명 | 성공, 서버_오류 |
status |
HTTP 응답 상태 코드 | 200, 500 등 |
uri |
요청 URI | /hello |
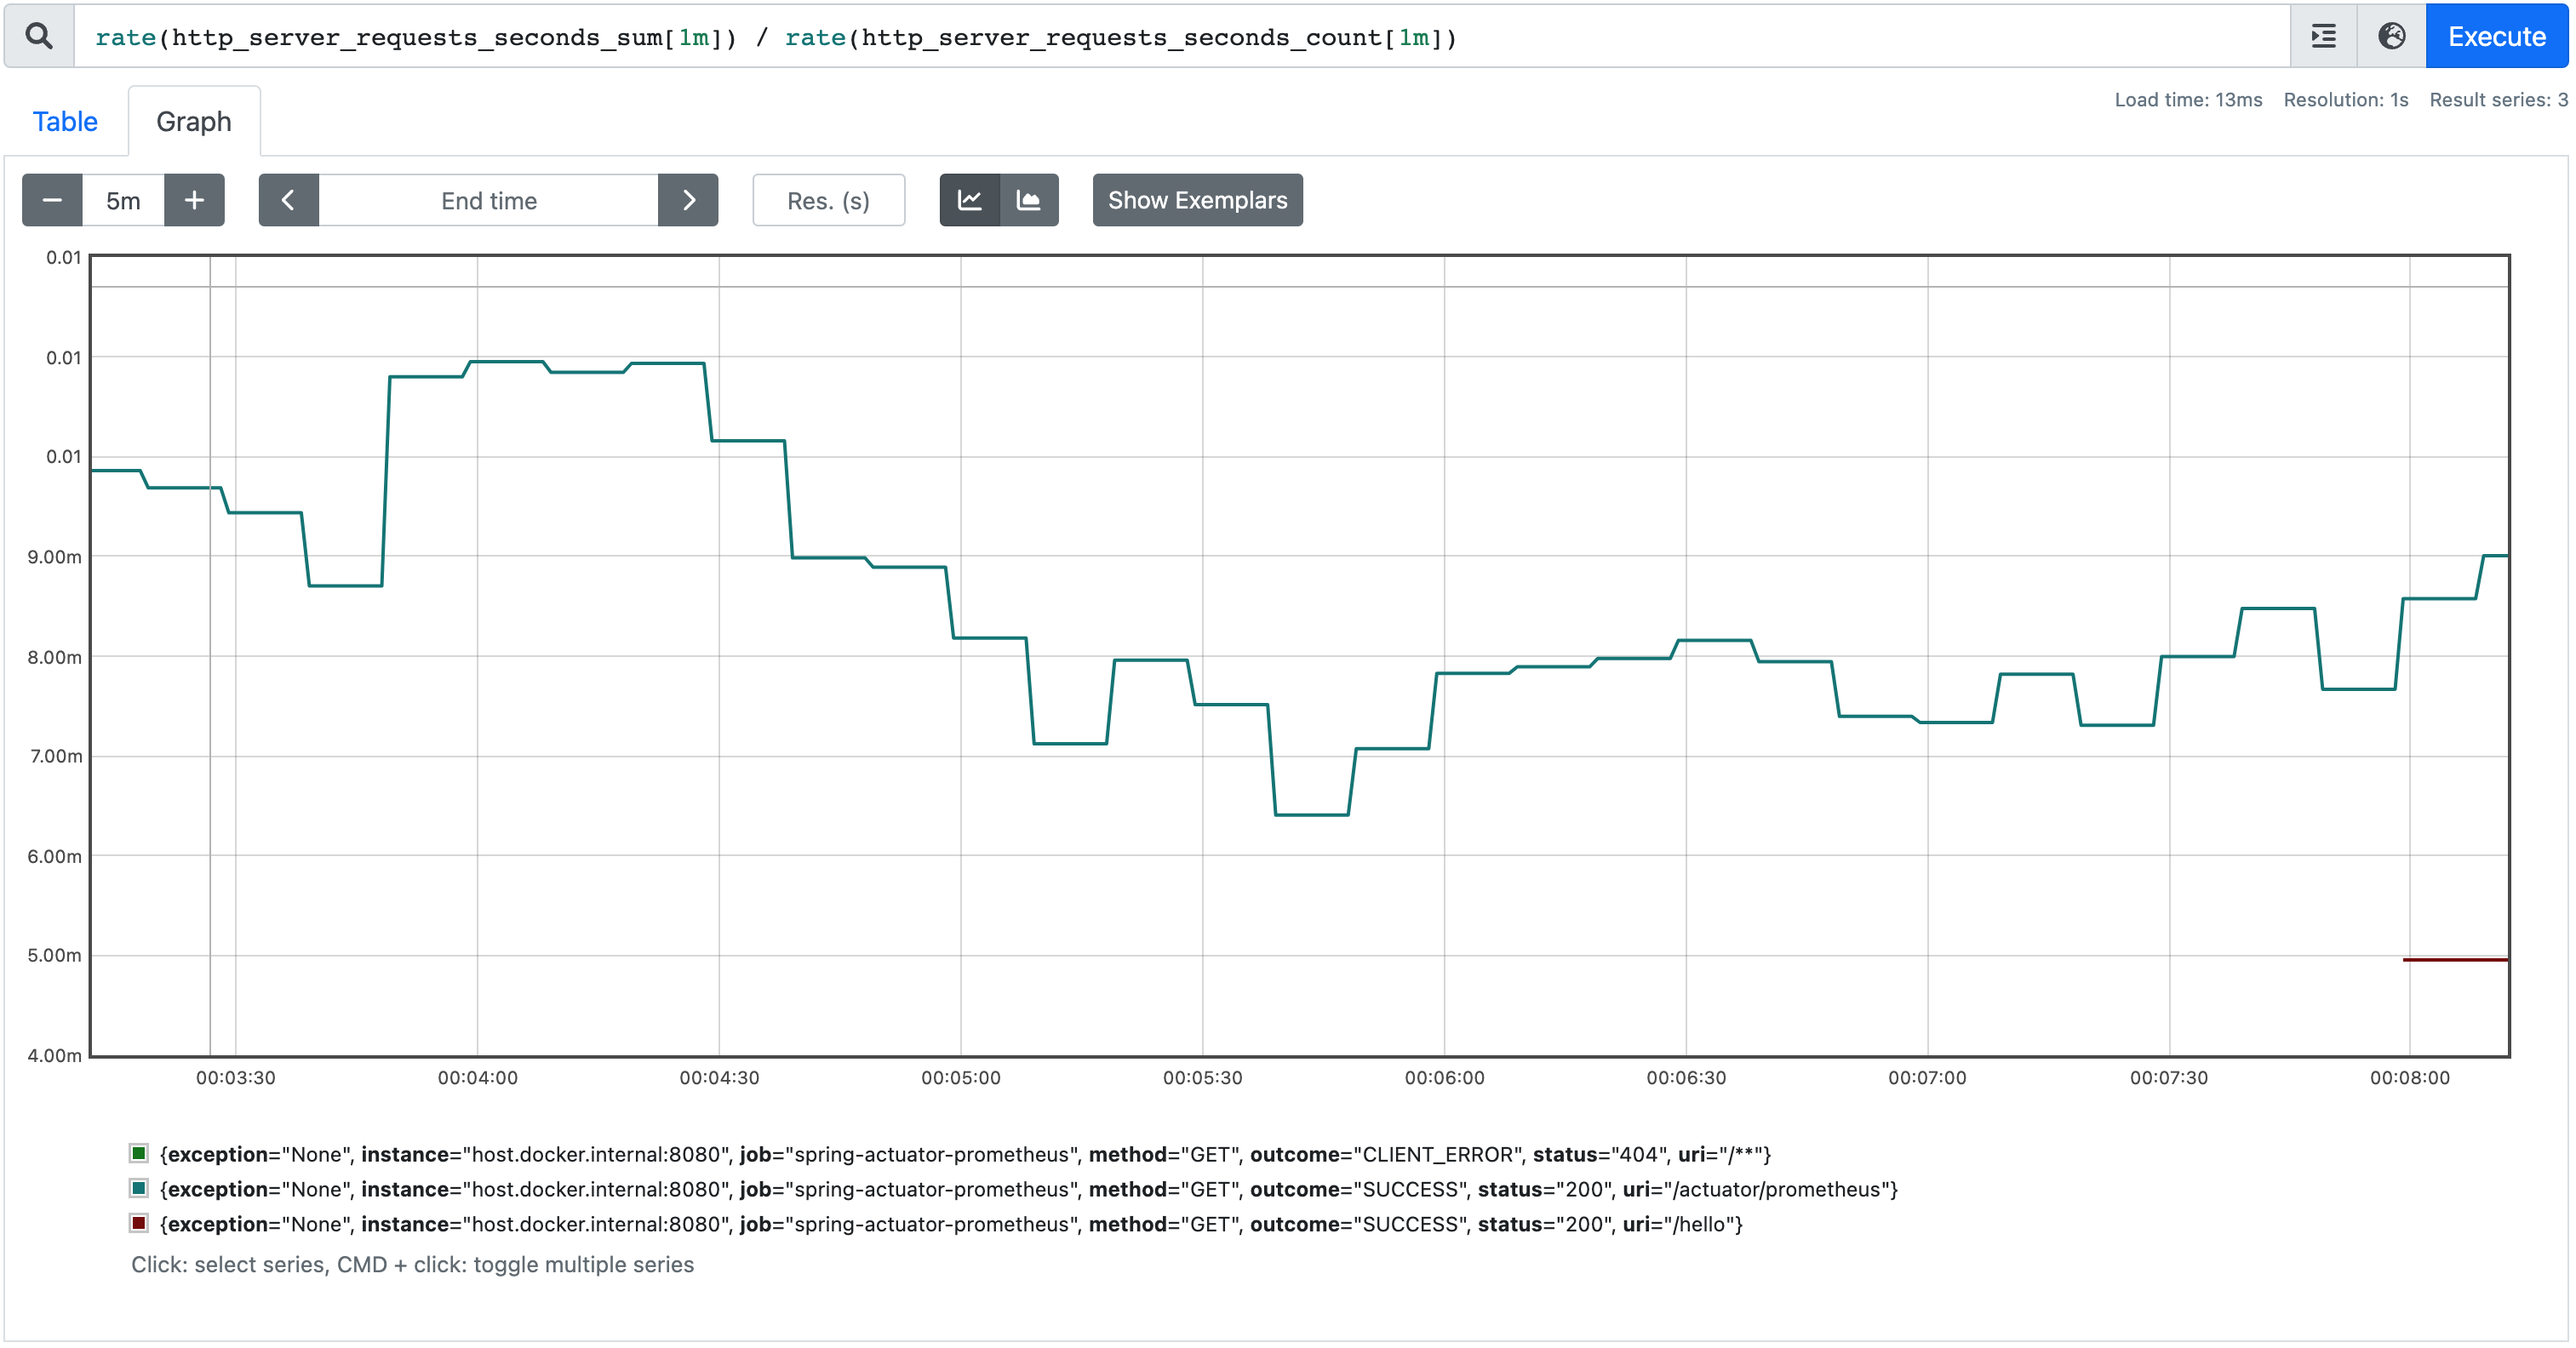
Prometheus에서는 모든 태그에 대한 평균 인바운드 요청 기간을 제공하는 간단한 쿼리를 만들 수 있다.
rate(http_server_requests_seconds_sum[1m]) / rate(http_server_requests_seconds_count[1m])
인바운드 HTTP 요청 분위수 및 백분위수
Spring MVC 메트릭은 또한 분위수와 백분위수(Percentile)를 계산할 수 있으며, 이는 가장 느린 요청을 무시 하면서 API의 요청 기간이 얼마나 느린지 평가하려는 경우에 유용할 수 있다.
예를 들어, 95번째 백분위수는 관찰된 값의 95%가 아래이고 5%가 위인 값이다. 즉, 요청의 95%가 보고 있는 가장 느린 요청 기간을 제공한다.
분위수를 활성화하려면 관심 있는 분위수(이름에도 불구하고 백분위수가 아님)로 대체 하여 추가 구성 속성을 application.properties에 추가해야 한다.
management.metrics.web.server.request.autotime.percentiles=<comma-separated list of quantiles>
속성을 0.95로 구성하면 /actuator/prometheus에서 다음과 같은 메트릭이 생성된다:
http_server_requests_seconds{exception="None",method="GET",outcome="SUCCESS",status="200",uri="/hello",quantile="0.95",} 0.023068672
이 메트릭과 함께 사용되는 태그는 위와 동일하지만 이제 메트릭을 쿼리하는 데 사용할 수 있는 quantile 태그도 있다.
http_server_requests_seconds{quantile="0.95"} 쿼리에서 Prometheus에 다음 그래프가 생성된다.
인바운드 HTTP 요청 최대 기간
Spring Boot 애플리케이션이 노출하는 각 엔드포인트 에 대해 각 인바운드 HTTP 요청 유형의 최대 지속 시간을 제공 하는 http_server_requests_seconds_max 게이지 메트릭을 얻는다.
# HELP http_server_requests_seconds_max Duration of HTTP server request handling
# TYPE http_server_requests_seconds_max gauge
http_server_requests_seconds_max{exception="None",method="GET",outcome="SUCCESS",status="200",uri="/hello",} 0.005831
http_server_requests_seconds_max는 기간 동안의 최대 요청 기간이다. 새 시간 창이 시작되면 값이 0으로 재설정된다. 기본 시간 창은 2분이다.
이 메트릭과 함께 사용되는 태그는 위와 동일 하다.
이 그래프는 일반 http_server_requests_seconds_max 쿼리에서 Prometheus에서 생성된다.

사용해 보기 이 문서에서 설명하는 모든 메트릭은 함께 제공되는 GitHub 리포지토리를 사용하여 즉시 시작하고 실행할 수 있다. 메트릭을 생성 하는 Spring Boot 애플리케이션 과 쿼리를 실행할 Prometheus 인스턴스가 포함되어 있다.
2. HTTP 클라이언트 RestTemplate 및 WebClient 아웃바운드 요청 메트릭
RestTemplate 또는 WebClient 클래스를 사용하여 아웃바운드 HTTP 요청을 수행하는 경우 인바운드 HTTP 요청과 유사한 요청 메트릭을 사용할 수 있다. 이러한 메트릭이 작동하려면 주입 된 RestTemplateBuilder 또는 WebClient.Builder 클래스를 사용하여 HTTP 클라이언트를 사용해야 하다.
아웃바운드 HTTP 요청 기간
각 아웃바운드 엔드포인트는 http_client_requests_seconds 메트릭을 가져온다. 이는 /actuator/prometheus 엔드포인트에 의해 노출되는 두 개의 메트릭으로 구성된다.
# HELP http_client_requests_seconds Timer of RestTemplate operation
# TYPE http_client_requests_seconds summary
http_client_requests_seconds_count{clientName="google.com",method="GET",outcome="SUCCESS",status="200",uri="/https://google.com",} 3.0
http_client_requests_seconds_sum{clientName="google.com",method="GET",outcome="SUCCESS",status="200",uri="/https://google.com",} 0.465022459
http_client_requests_seconds_count는 애플리케이션이 이 엔드포인트에 대해 수행한 총 요청 수이다.http_client_requests_seconds_sum은 애플리케이션이 이 엔드포인트에 대해 수행한 모든 요청 기간의 합계이다.
이러한 메트릭에는 다음 태그도 포함된다.
| 태그 | 설명 |
|---|---|
clientName |
URI의 호스트를 사용하여 호출하는 엔드포인트의 이름 |
exception |
발생한 예외의 클래스 이름 |
method |
HTTP 요청 방법 |
outcome |
HTTP 응답 상태에 대한 문자열 설명 |
status |
HTTP 응답 상태 코드 |
uri |
요청 URI |
Prometheus에서는 시간 경과에 따른 평균 아웃바운드 요청 기간을 제공하는 간단한 쿼리를 만들 수 있다.
rate(http_client_requests_seconds_sum[1m]) / rate(http_client_requests_seconds_count[1m])
아웃바운드 HTTP 요청 최대 기간
각 아웃바운드 엔드포인트는 http_client_requests_seconds_max 게이지 지표를 가져오며 각 아웃바운드 HTTP 요청 유형의 최대 지속 시간을 제공한다.
# HELP http_client_requests_seconds_max Timer of RestTemplate operation
# TYPE http_client_requests_seconds_max gauge
http_client_requests_seconds_max{clientName="google.com",method="GET",outcome="SUCCESS",status="200",uri="/https://google.com",} 0.205564498
http_client_requests_seconds_max는 기간 동안의 최대 요청 기간이다. 새 시간 창이 시작되면 값이 0으로 재설정된다. 기본 시간 창은 2분이다.
이 메트릭과 함께 사용되는 태그는 위에 “아웃바운드 HTTP 요청 기간"와 같다.
이 그래프는 일반 쿼리에서 Prometheus에서 생성된다 http_client_requests_seconds_max.
3. JVM 메트릭
Micrometer에는 JVM(Java Virtual Machine)에서 발생하는 상황을 모니터링하는 데 도움이 되는 세 가지 유형의 메트릭이 포함되어 있다.
JVM 메모리 메트릭
각 메모리 영역에 대해 jvm_memory_used_bytes에서 사용된 메모리 양과 jvm_memory_max_bytes에서 사용 가능한 메모리 양을 확인할 수 있다.
# HELP jvm_memory_used_bytes The amount of used memory
# TYPE jvm_memory_used_bytes gauge
jvm_memory_used_bytes{area="heap",id="G1 Survivor Space",} 8388608.0
jvm_memory_used_bytes{area="heap",id="G1 Old Gen",} 3938936.0
jvm_memory_used_bytes{area="nonheap",id="Metaspace",} 4.2306152E7
jvm_memory_used_bytes{area="nonheap",id="CodeHeap 'non-nmethods'",} 1244928.0
jvm_memory_used_bytes{area="heap",id="G1 Eden Space",} 8.8080384E7
jvm_memory_used_bytes{area="nonheap",id="Compressed Class Space",} 5433064.0
jvm_memory_used_bytes{area="nonheap",id="CodeHeap 'non-profiled nmethods'",} 9665152.0

...

# HELP jvm_memory_max_bytes The maximum amount of memory in bytes that can be used for memory management
# TYPE jvm_memory_max_bytes gauge
jvm_memory_max_bytes{area="heap",id="G1 Survivor Space",} -1.0
jvm_memory_max_bytes{area="heap",id="G1 Old Gen",} 8.589934592E9
jvm_memory_max_bytes{area="nonheap",id="Metaspace",} -1.0
jvm_memory_max_bytes{area="nonheap",id="CodeHeap 'non-nmethods'",} 7553024.0
jvm_memory_max_bytes{area="heap",id="G1 Eden Space",} -1.0
jvm_memory_max_bytes{area="nonheap",id="Compressed Class Space",} 1.073741824E9
jvm_memory_max_bytes{area="nonheap",id="CodeHeap 'non-profiled nmethods'",} 2.44105216E8
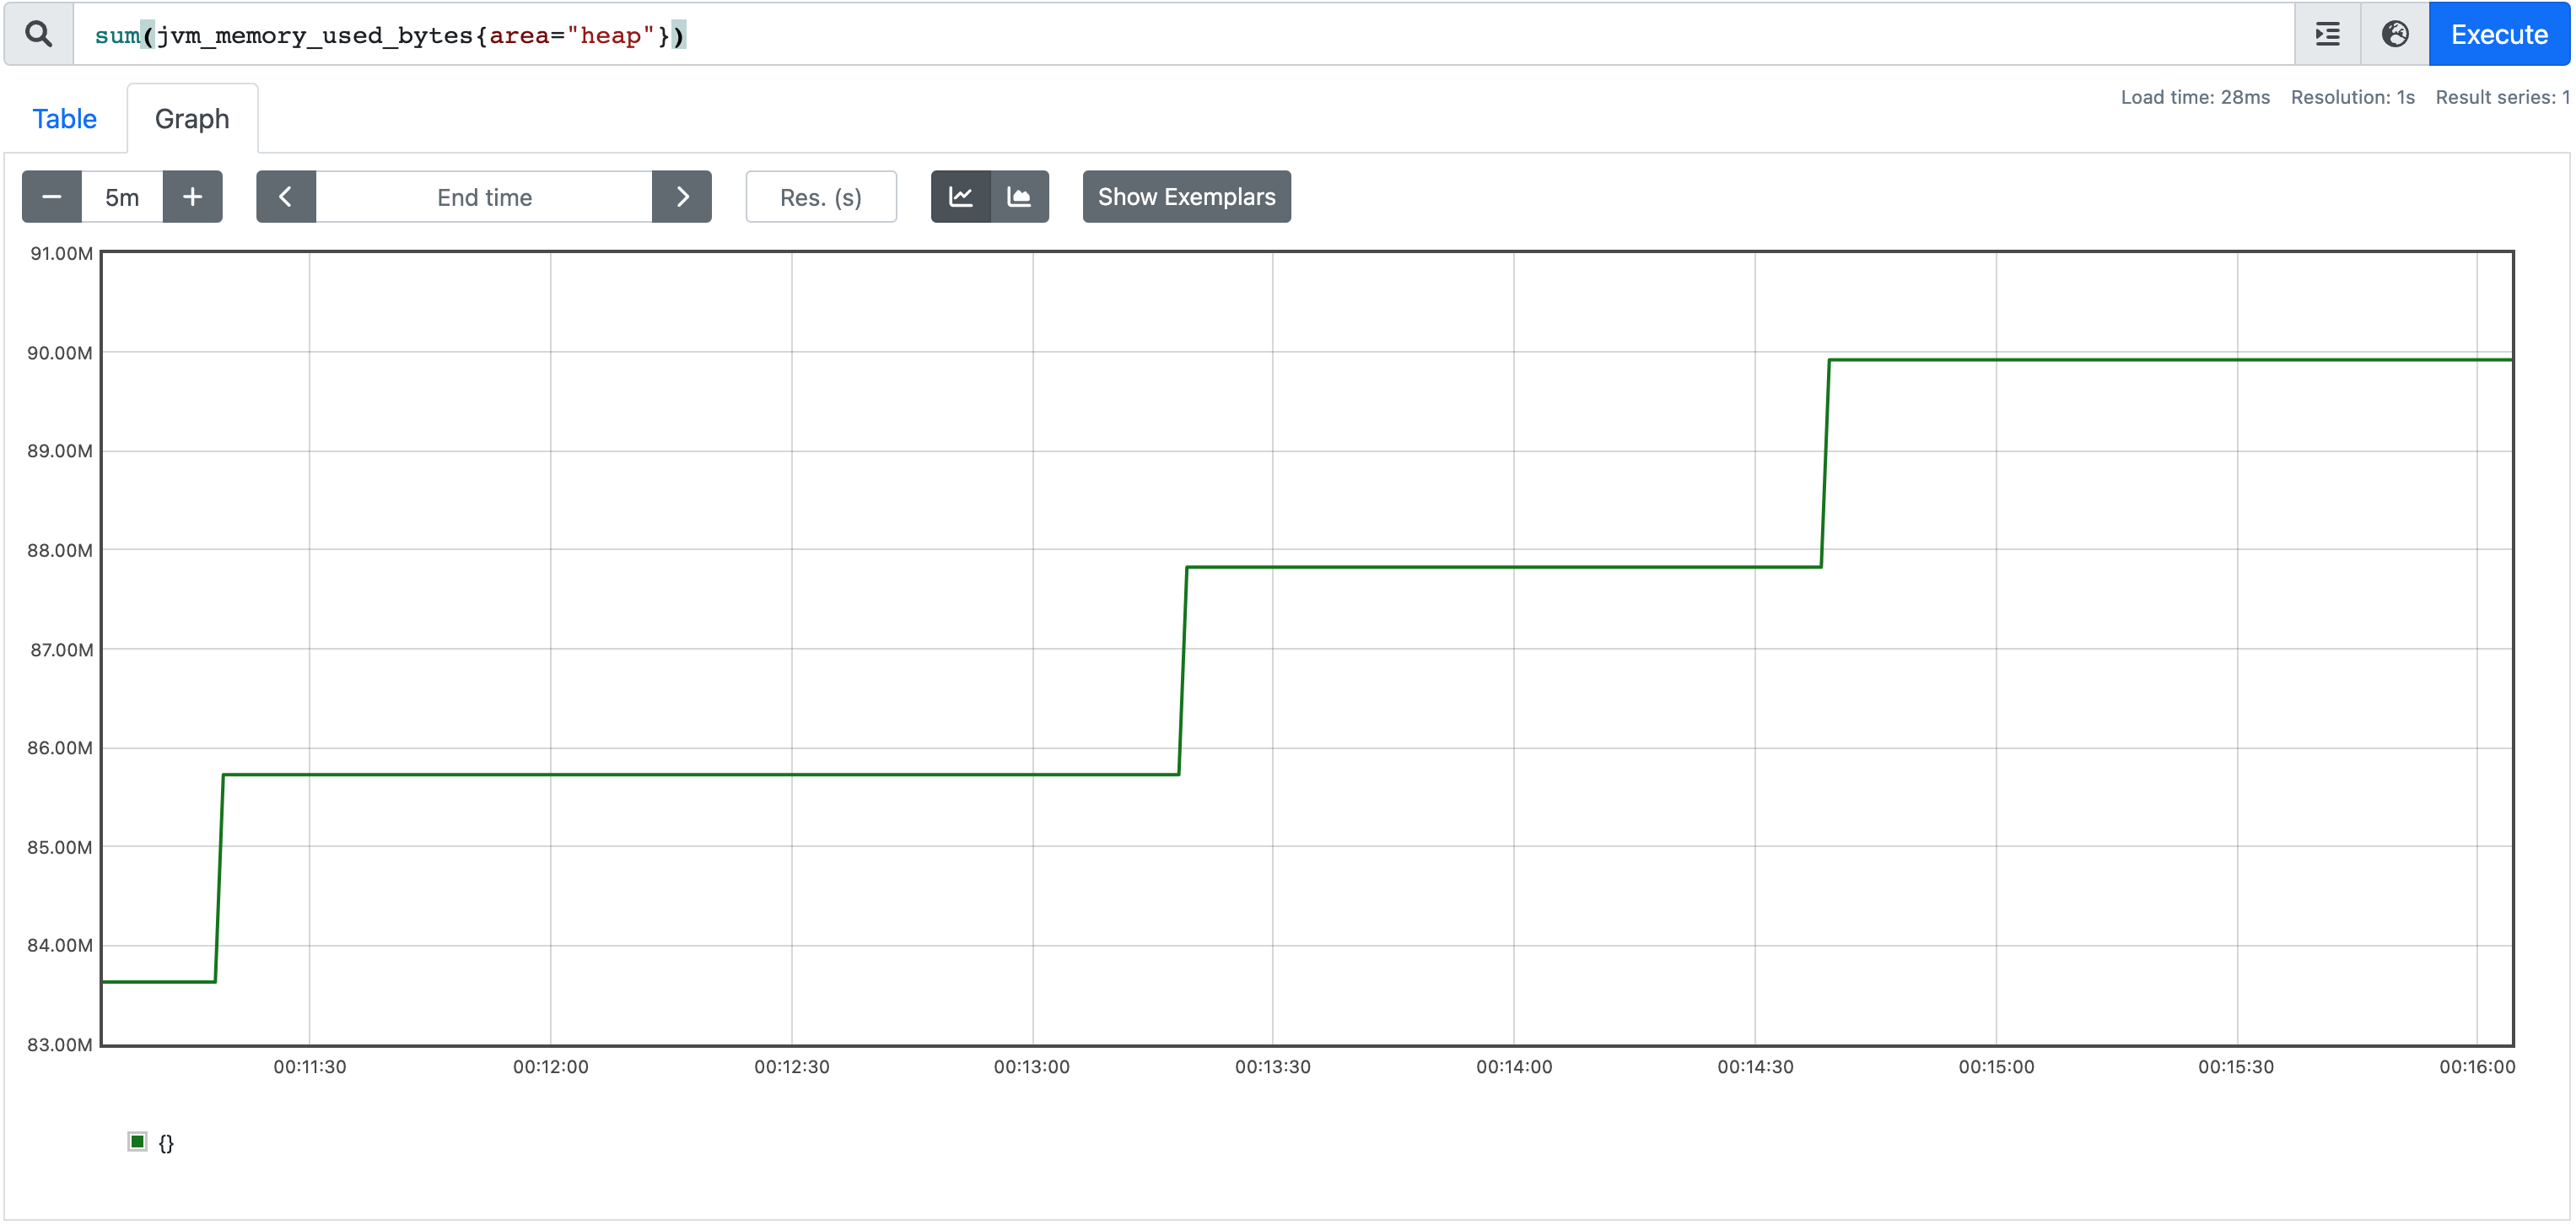
여기에는 많은 데이터가 있지만 예를 들어 Prometheus에서 다음 쿼리를 사용하여 수행할 수 있는 사용된 힙 유형 메모리 의 총량을 표시할 수 있다.
sum(jvm_memory_used_bytes{area="heap"})
이는 Prometheus sum 함수를 사용하여 위의 id 태그 에서 볼 수 있는 모든 유형의 힙 메모리 영역(G1 Survivor Space, G1 Old Gen, G1 Eden Space)에서 사용된 메모리를 합산한다.
JVM 가비지 수집 지표
JVM이 메모리를 관리하는 방법에 대한 깊은 통찰력을 얻기 위해 사용할 수 있는 많은 가비지 수집 지표가 있다. 크게 다음 영역으로 나눌 수 있다.
일시중지 시간
jvm_gc_pause_seconds와 jvm_gc_pause_seconds_max 메트릭은 가비지 수집에 소요된 시간에 대한 정보를 제공한다.
# HELP jvm_gc_pause_seconds Time spent in GC pause
# TYPE jvm_gc_pause_seconds summary
jvm_gc_pause_seconds_count{action="end of minor GC",cause="Metadata GC Threshold",} 1.0
jvm_gc_pause_seconds_sum{action="end of minor GC",cause="Metadata GC Threshold",} 0.005
jvm_gc_pause_seconds_count{action="end of minor GC",cause="G1 Evacuation Pause",} 9.0
jvm_gc_pause_seconds_sum{action="end of minor GC",cause="G1 Evacuation Pause",} 0.074
# HELP jvm_gc_pause_seconds_max Time spent in GC pause
# TYPE jvm_gc_pause_seconds_max gauge
jvm_gc_pause_seconds_max{action="end of minor GC",cause="Metadata GC Threshold",} 0.0
jvm_gc_pause_seconds_max{action="end of minor GC",cause="G1 Evacuation Pause",} 0.004
메모리 풀 크기 증가
jvm_gc_memory_allocated_bytes_total 지표는 젊은 세대 메모리 풀의 크기 증가에 대해 알려주는 반면 jvm_gc_memory_promoted_bytes_total 메트릭은 이전 세대에 대한 것이다.
# HELP jvm_gc_memory_allocated_bytes_total Incremented for an increase in the size of the young generation memory pool after one GC to before the next
# TYPE jvm_gc_memory_allocated_bytes_total counter
jvm_gc_memory_allocated_bytes_total 2.66338304E8
# HELP jvm_gc_memory_promoted_bytes_total Count of positive increases in the size of the old generation memory pool before GC to after GC
# TYPE jvm_gc_memory_promoted_bytes_total counter
jvm_gc_memory_promoted_bytes_total 1.4841448E7
라이브 구세대 풀 크기
jvm_gc_live_data_size_bytes 메트릭 은 이전 세대 풀 크기를 알려준다. jvm_gc_max_data_size_bytes는 old generation 풀에 할당할 수 있는 최대 크기를 알려준다.
# HELP jvm_gc_live_data_size_bytes Size of old generation memory pool after a full GC
# TYPE jvm_gc_live_data_size_bytes gauge
jvm_gc_live_data_size_bytes 9039328.0
# HELP jvm_gc_max_data_size_bytes Max size of old generation memory pool
# TYPE jvm_gc_max_data_size_bytes gauge
jvm_gc_max_data_size_bytes 5.22190848E8
JVM 스레드 메트릭
이러한 지표를 통해 JVM에 있는 스레드를 확인할 수 있다.
# HELP jvm_threads_states_threads The current number of threads having NEW state
# TYPE jvm_threads_states_threads gauge
jvm_threads_states_threads{state="runnable",} 7.0
jvm_threads_states_threads{state="blocked",} 0.0
jvm_threads_states_threads{state="waiting",} 11.0
jvm_threads_states_threads{state="timed-waiting",} 3.0
jvm_threads_states_threads{state="new",} 0.0
jvm_threads_states_threads{state="terminated",} 0.0
# HELP jvm_threads_live_threads The current number of live threads including both daemon and non-daemon threads
# TYPE jvm_threads_live_threads gauge
jvm_threads_live_threads 21.0
# HELP jvm_threads_daemon_threads The current number of live daemon threads
# TYPE jvm_threads_daemon_threads gauge
jvm_threads_daemon_threads 17.0
# HELP jvm_threads_peak_threads The peak live thread count since the Java virtual machine started or peak was reset
# TYPE jvm_threads_peak_threads gauge
jvm_threads_peak_threads 23.0
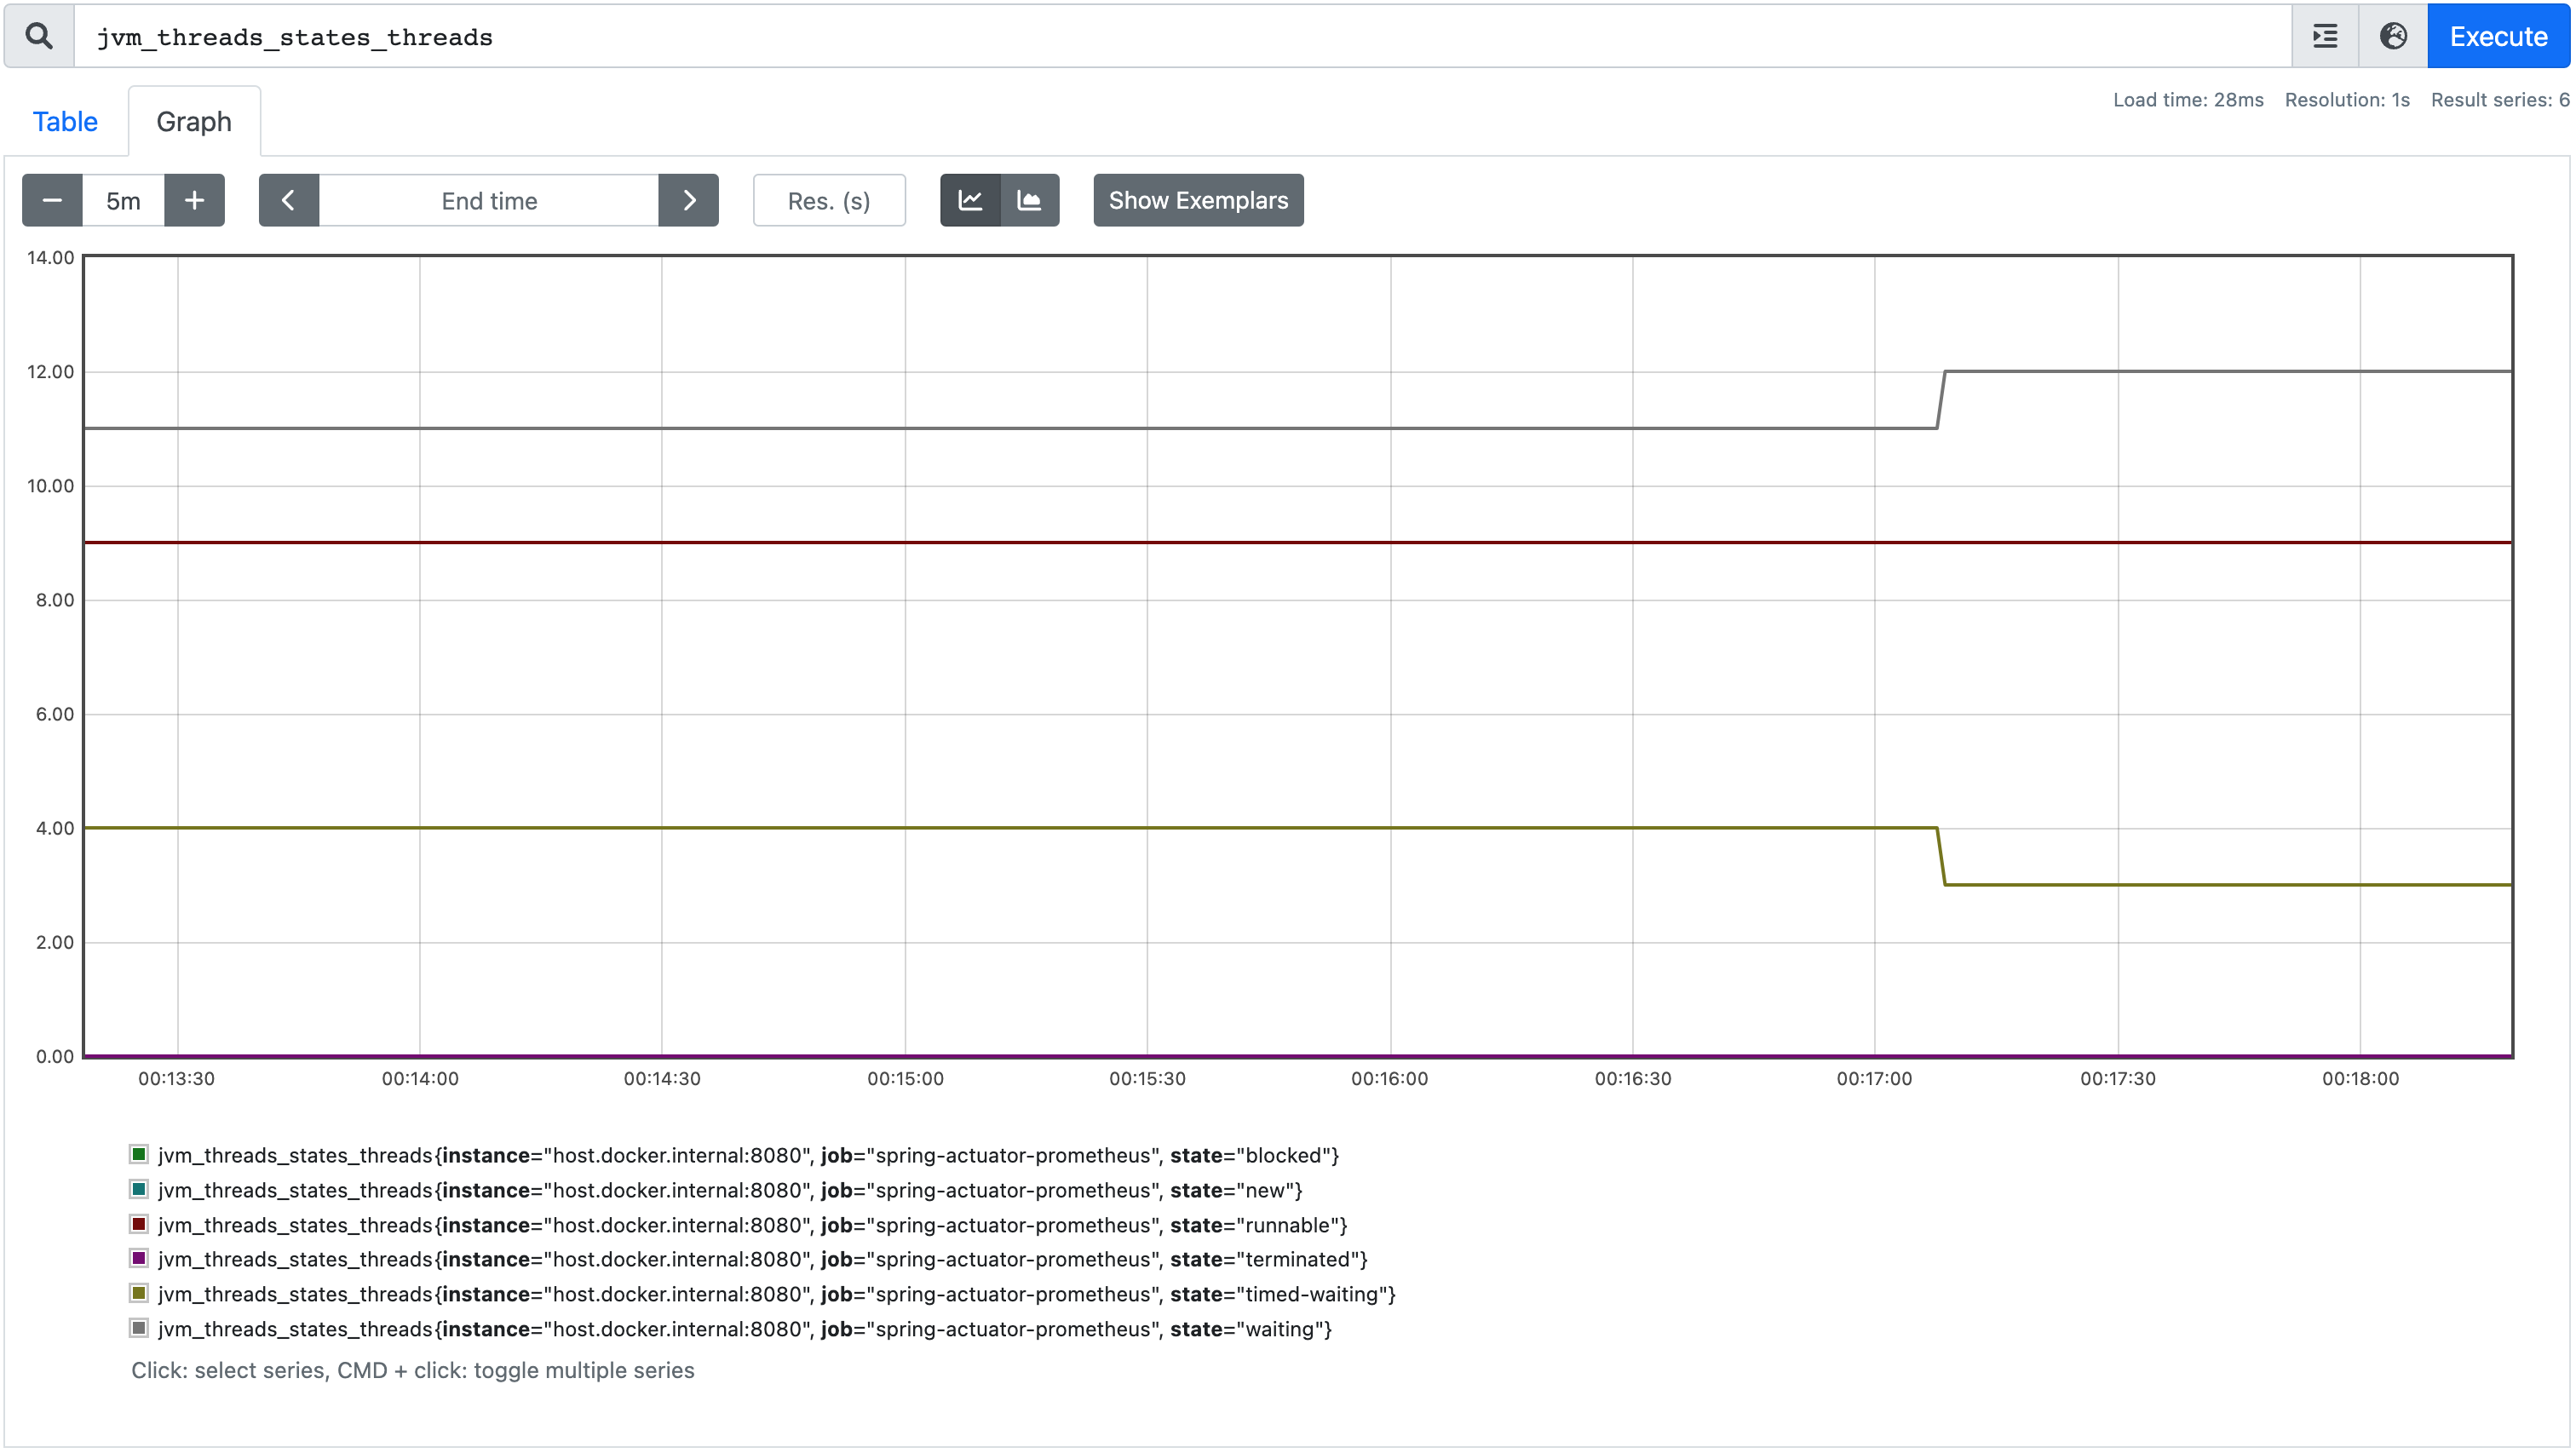
jvm_threads_states_threads는 각 스레드 상태에 있는 스레드 수를 보여준다.jvm_threads_live_threads는 데몬 및 데몬이 아닌 스레드를 포함한 총 라이브 스레드 수를 보여준다.jvm_threads_daemon_threads는 총 데몬 스레드 수를 보여준다.jvm_threads_peak_threads는 JVM이 시작된 이후 최대 총 스레드 수를 보여준다.
Prometheus에서 실행 jvm_threads_states_threads하면 그래프에서 모든 스레드 상태를 볼 수 있다.