Spring Boot + Prometheus + Grafana + Docker로 애플리케이션 모니터링 연동 퀵가이드

개요
Spring Boot의 Actuator를 활용하여 Metrics 측정 정보를 Prometheus에 전달하고, 이를 시각화 하는 구성을 해도록 하겠다.
Spring Boot 프로젝트 생성
먼저, Spring Boot에서 Prometheus에 전달하는 프로젝트를 생성한다.
신규 프로젝트 생성 명령
아래와 같이 curl 명령어를 사용하여 Spring Boot 신규 프로젝트를 생성한다.
curl https://start.spring.io/starter.tgz \
-d bootVersion=2.7.6 \
-d dependencies=web,actuator,prometheus \
-d baseDir=spring-actuator-prometheus \
-d groupId=com.devkuma \
-d artifactId=spring-actuator-prometheus \
-d packageName=com.devkuma.prometheus \
-d applicationName=ActuatorPrometheusApplication \
-d javaVersion=11 \
-d packaging=jar \
-d type=gradle-project | tar -xzvf -
위 명령어에서는 Java 11, Spring Boot 버전은 2.7.6을 사용하였고, 의존성으로 “web, actuator, prometheus"를 추가하였다.
빌드 파일에 의존성 내용 확인
build.gradle
dependencies {
	implementation 'org.springframework.boot:spring-boot-starter-actuator'
	implementation 'org.springframework.boot:spring-boot-starter-web'
	runtimeOnly 'io.micrometer:micrometer-registry-prometheus'
	testImplementation 'org.springframework.boot:spring-boot-starter-test'
}
spring-boot-starter-actuator는 Spring Boot 애플리케이션의 정보를 다룰 수 있다.- Spring Boot 2.0 이상부터는 Actuator에는 애플리케이션의 metric 측정을 할 수 있는 Micrometer을 제공 기능을 포함하고 있다.
micrometer-registry-prometheus는 Prometheus가 읽을 수 있는 metrics를 제공하는 역할을 한다.- 이 라이브러리에는 Micrometer가 만들어내는 metric을 Prometheus 서버에서 사용할 수 있는 metric format으로 변경해 준다.
Actuator Endpoint 설정
Spring Web에서 Actuator는 Micrometer를 통해 생성된 애플리케이션의 metric 정보를 Prometheus 서버에서 가져갈(Pull)수 있도록 추가적인 endpoint를 제공해준다.
Actuator는 application.yml에 옵션(management.endpoints.web.exposure.include)으로 /actuator 페이지에 노출할 endpoint 목록을 설정할 수 있다.
/src/main/resources/application.yml
management:
  endpoints:
    web:
      exposure:
        include: health, prometheus
여기에서는 default로 들어가는 health와 Prometheus endpoint로 추가하였다.
애플리케이션에 제공하는 endpoint 목록 확인
애플리케이션을 실행하고 http://localhost:8080/actuator에 접속해 보면, Actuator가 제공하는 endpoint 목록을 확인할 수 있다.
{
    "_links": {
        "self": {
            "href": "http://localhost:8080/actuator",
            "templated": false
        },
        "health-path": {
            "href": "http://localhost:8080/actuator/health/{*path}",
            "templated": true
        },
        "health": {
            "href": "http://localhost:8080/actuator/health",
            "templated": false
        },
        "prometheus": {
            "href": "http://localhost:8080/actuator/prometheus",
            "templated": false
        }
    }
}
여기에서 http://localhost:8080/actuator/prometheus에서는 Micrometer를 통해 수집된 metric들을 확인할 수 있다.
# HELP tomcat_sessions_active_current_sessions
# TYPE tomcat_sessions_active_current_sessions gauge
tomcat_sessions_active_current_sessions 0.0
# HELP jvm_gc_pause_seconds Time spent in GC pause
# TYPE jvm_gc_pause_seconds summary
jvm_gc_pause_seconds_count{action="end of minor GC",cause="Metadata GC Threshold",} 1.0
jvm_gc_pause_seconds_sum{action="end of minor GC",cause="Metadata GC Threshold",} 0.006
# HELP jvm_gc_pause_seconds_max Time spent in GC pause
# TYPE jvm_gc_pause_seconds_max gauge
jvm_gc_pause_seconds_max{action="end of minor GC",cause="Metadata GC Threshold",} 0.006

... 이하 생략 ...
여기에서는 각각이 Prometheus가 인식할 수 있는 Metrics(tomcat_sessions_active_current_sessions, jvm_gc_pause_seconds_count 등) 이 표시되고 있고, 메트릭 위에 HELP(도움말)와 TYPE를 확인할 수 있다.
Prometheus 서버
이제 애플리케이션는 준비가 되었으니, 애플리케이션에서 생성하는 metric을 수집하기 위한 Prometheus Server를 준비해 보자.
여기에서 Docker에 설치된 프로메테우스를 활용할 것이다. 프로메테우스 도커 설치는 여기를 참고 하길 바란다.
Prometheus 서버 설정
Prometheus 서버 기동시 설정 파일(prometheus.yml)을 아래와 같이 설정한다.
/etc/prometheus/prometheus.yml
global:
  scrape_interval: 10s # 10초 마다 Metric을 Pulling
  evaluation_interval: 10s # rule 을 얼마나 빈번하게 검증하는지 설정
scrape_configs:
  - job_name: 'spring-actuator-prometheus'
    metrics_path: '/actuator/prometheus' # Application prometheus endpoint
    static_configs:
      - targets: ['host.docker.internal:8080'] # Application host:port
Prometheus 서버 확인
이제 프로메테우스 Docker를 실행 시켜서, 프로메테우스에 접속해 보자.
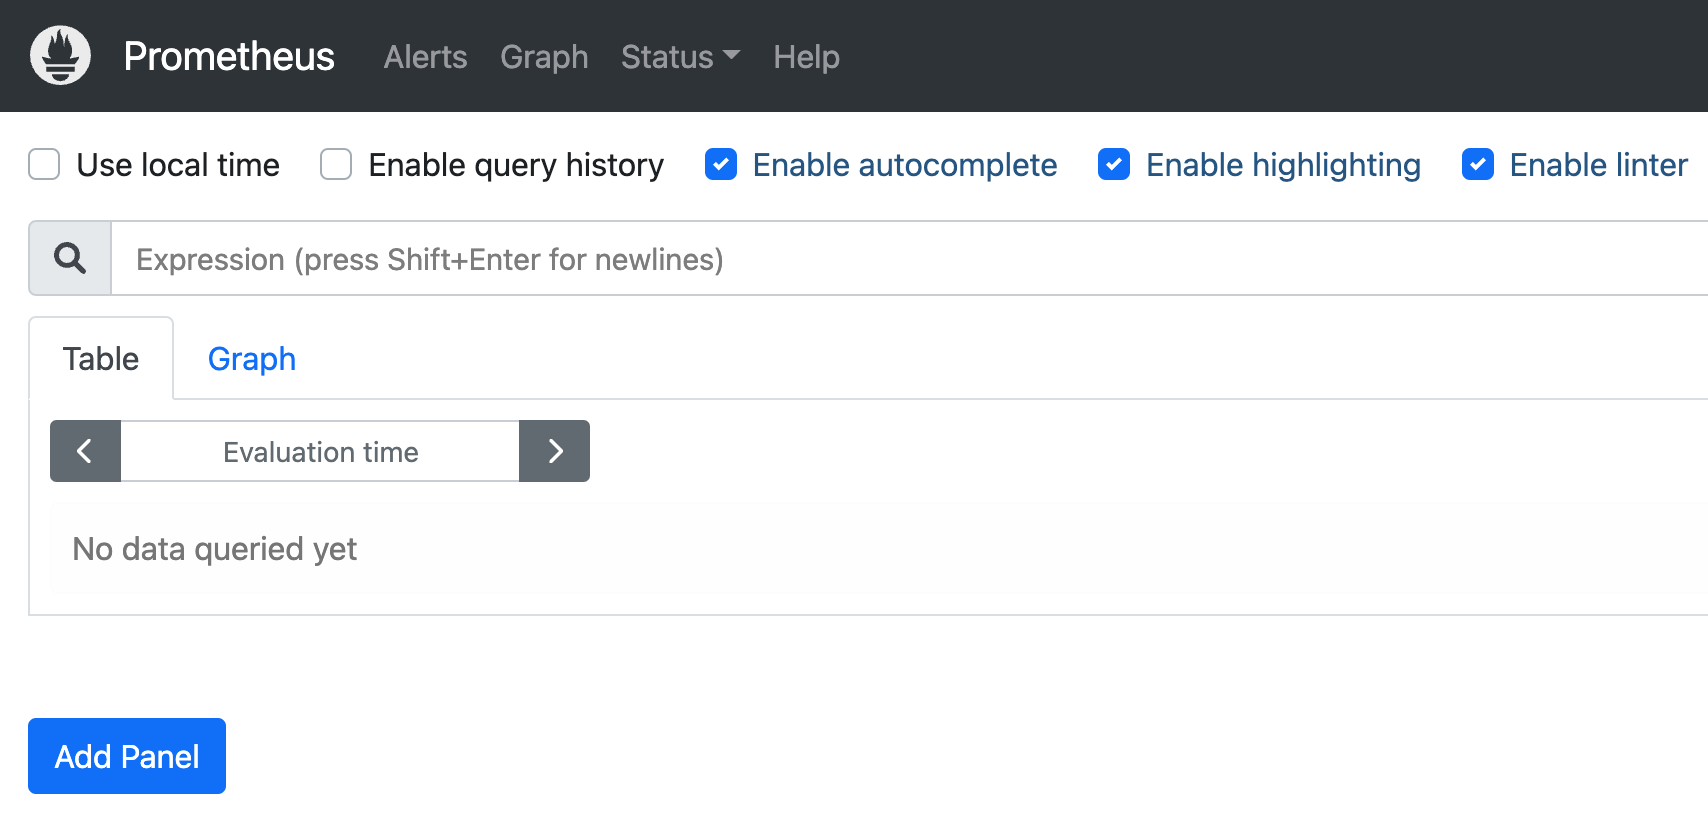
위에서 문제가 없었다면, Prometheus(http://localhost:9090)에 접속해 보면, 다음과 같이 Prometheus의 메인 화면을 확인할 수 있다.
Status > Configuration 메뉴에서는 Prometheus에 설정한 파일이 적용 되어 있는지 확인할 수 있다.

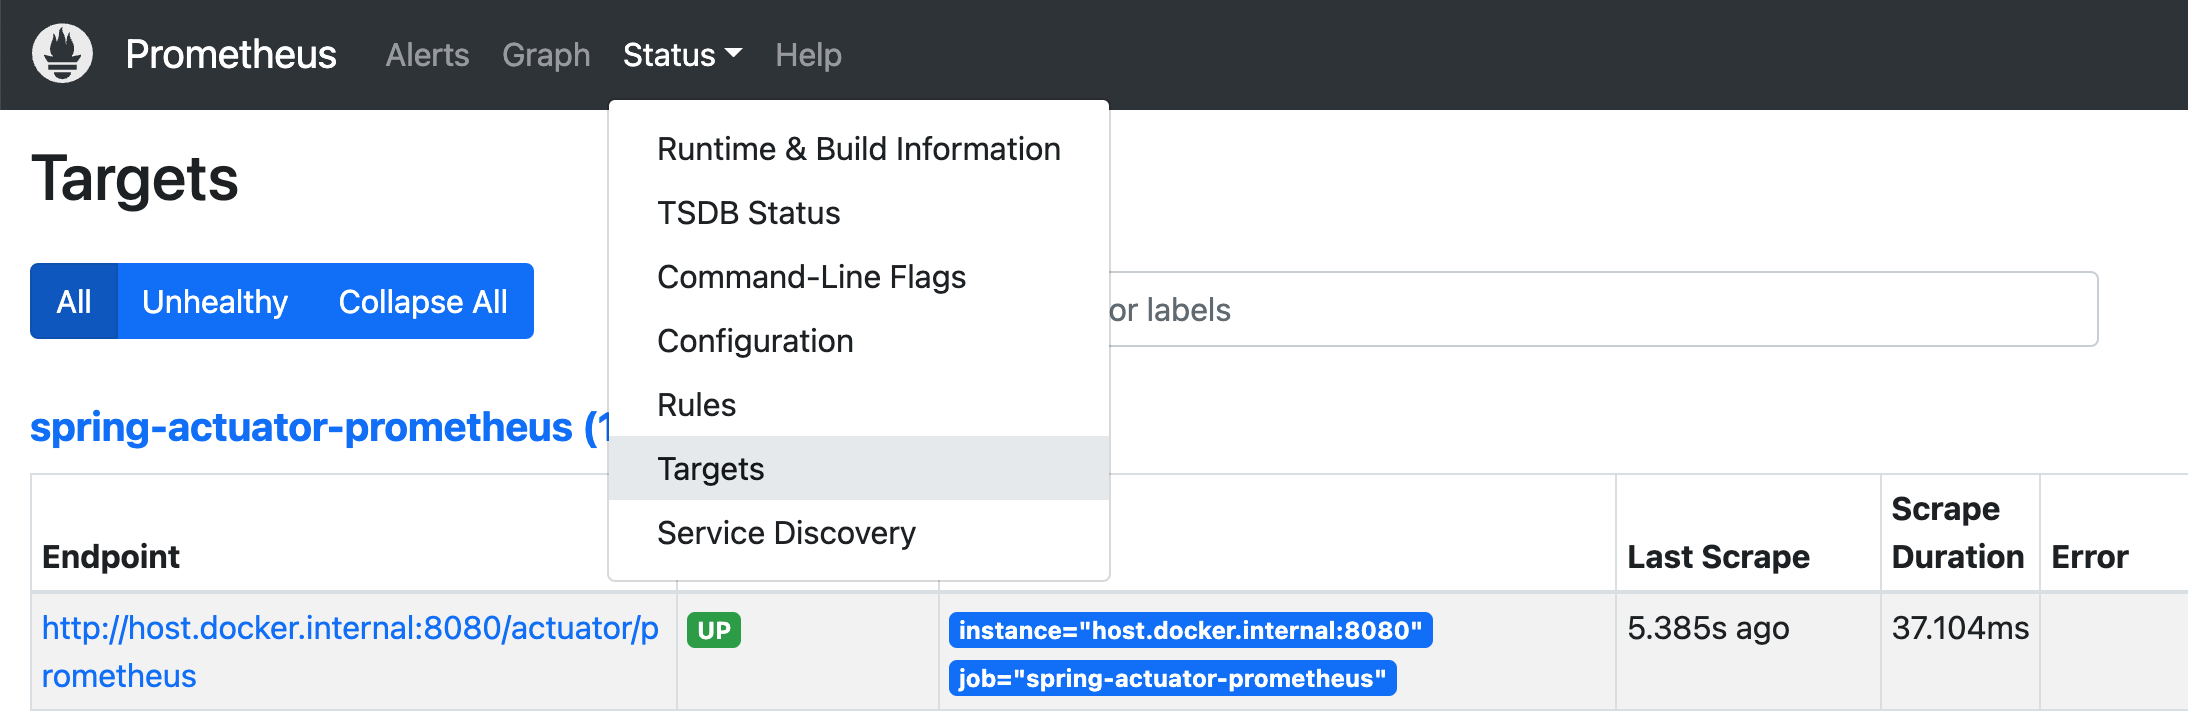
Status > Targets 메뉴에서는 연결된 Application 상태를 확인할 수 있다.
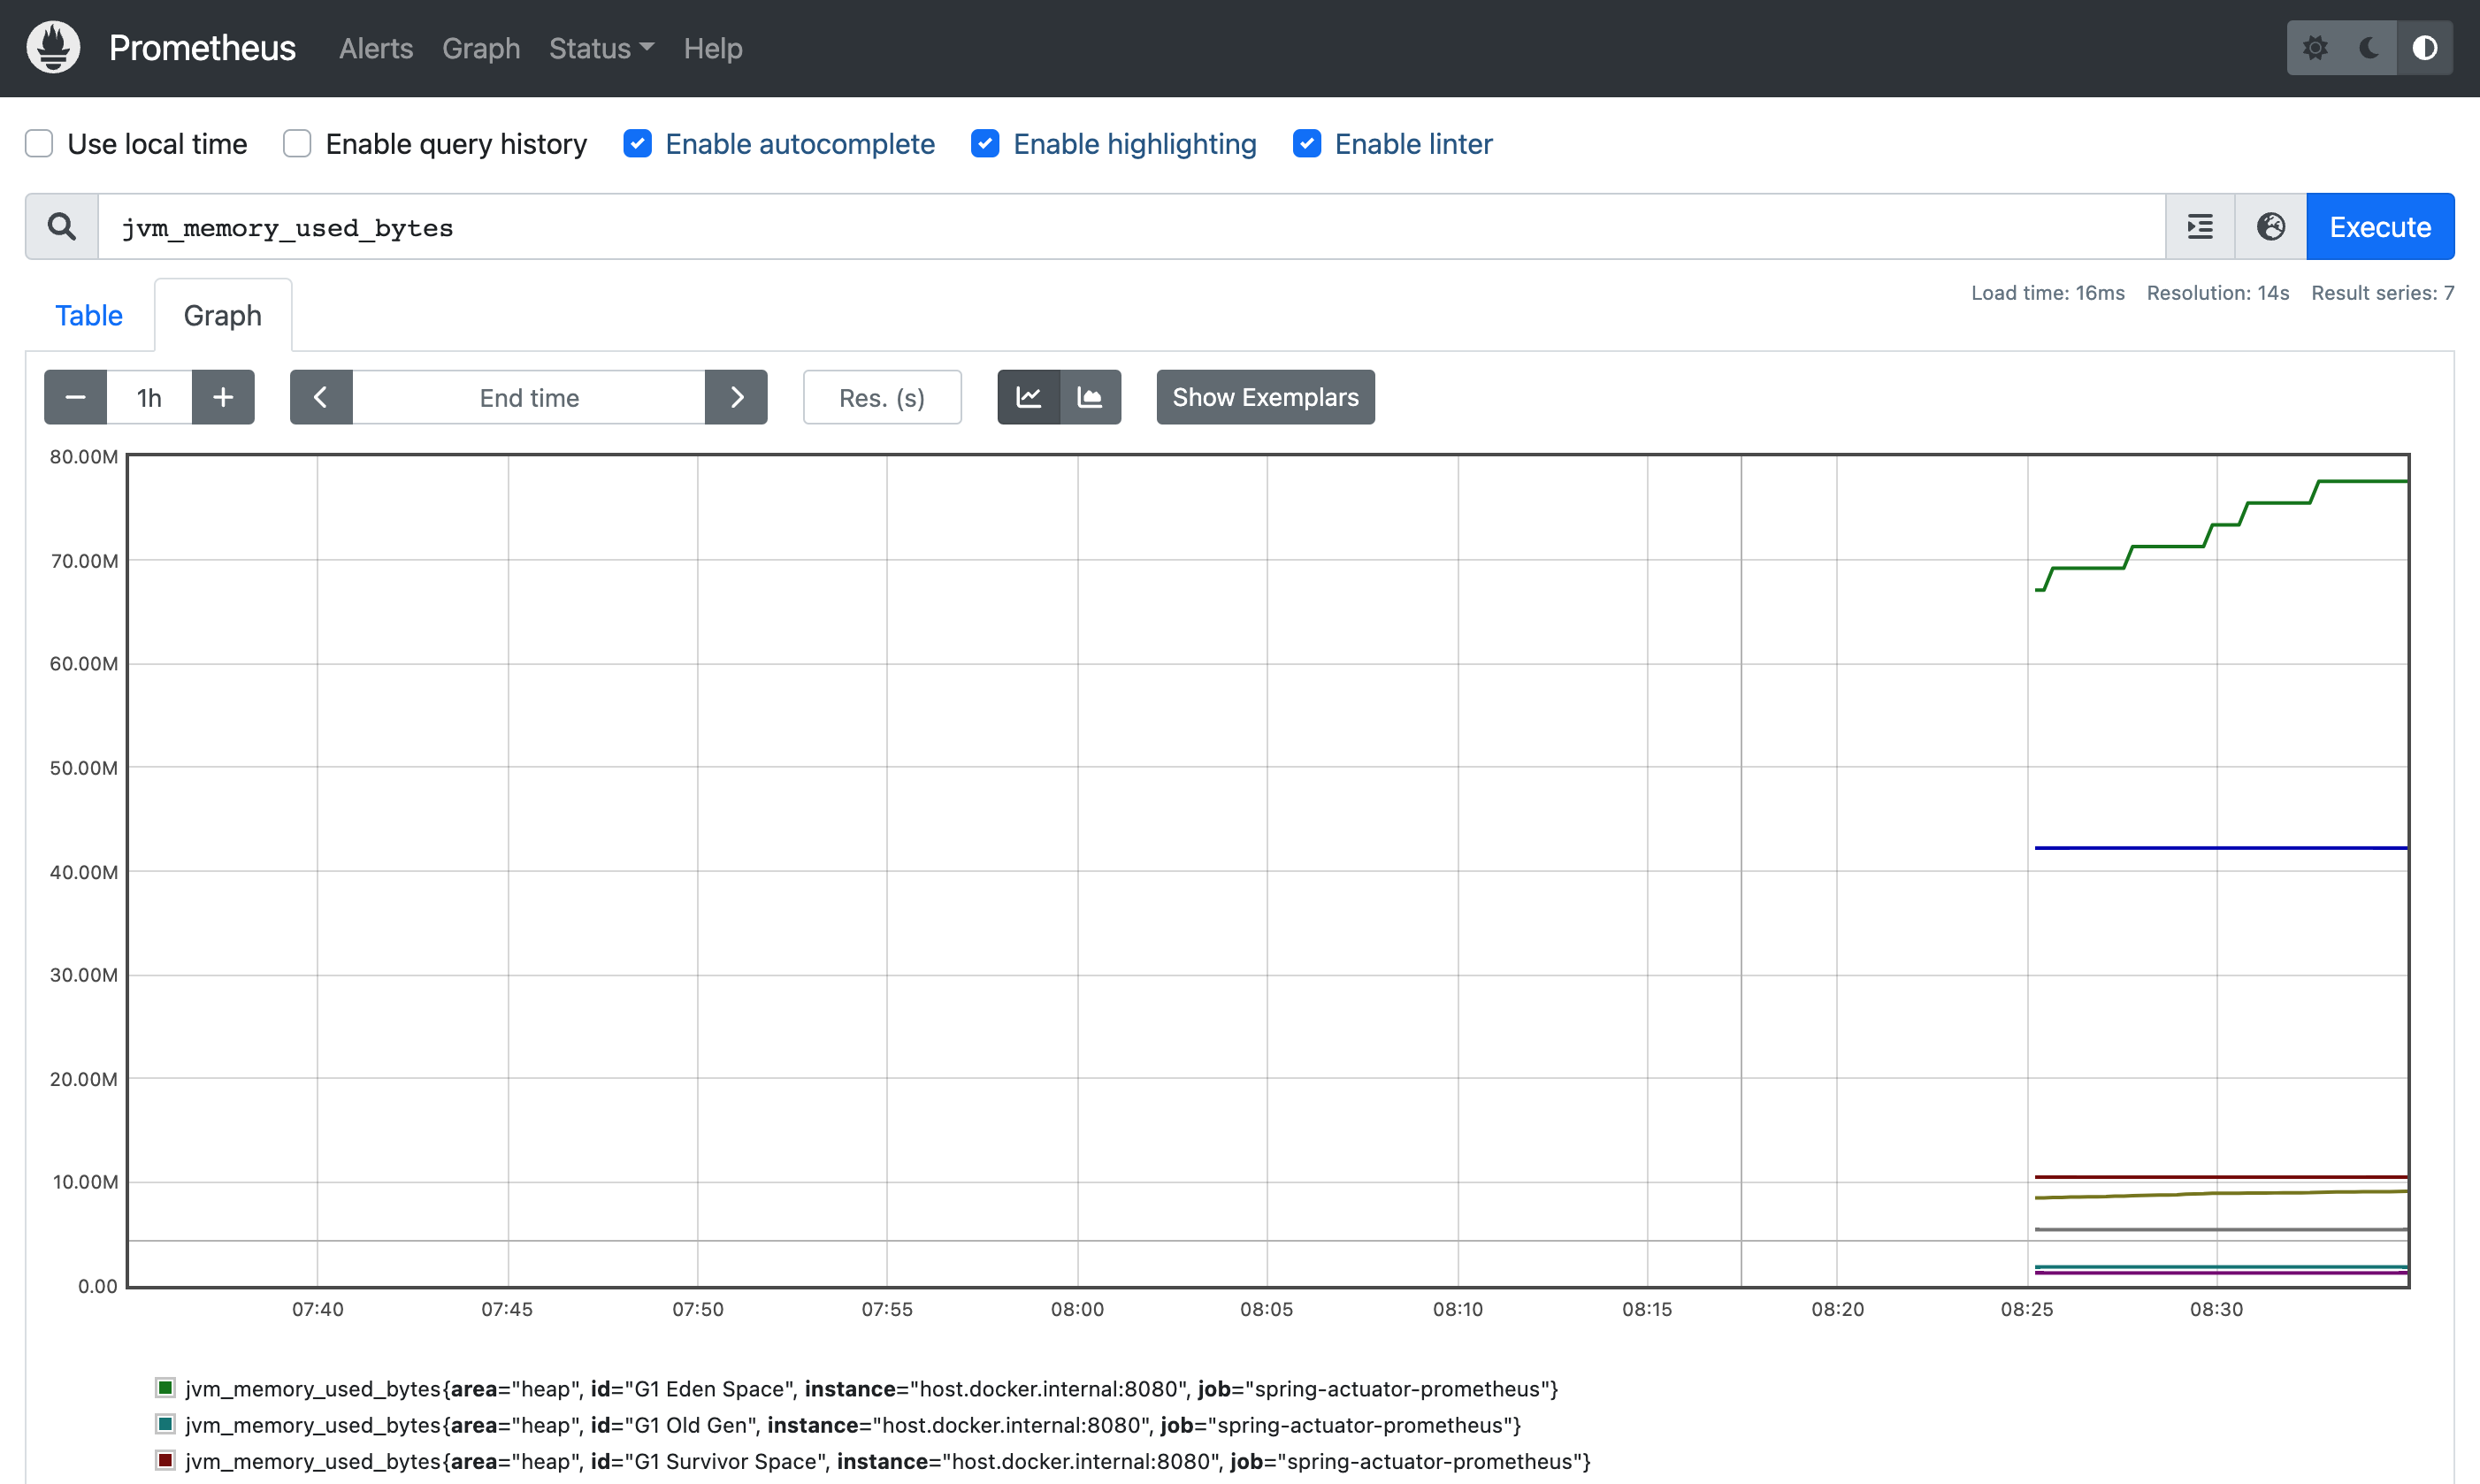
그리고 마지막으로 메인 화면으로 와서 Expression에 jvm_memory_used_bytes을 입력하고 실행시키고, Graph을 선택하면 아래와 같은 그래프 차트를 볼 수 있다.
Grafana 서버
이제는 Prometheus에서 수집한 metric을 Grafana로 시각화하는 방법에 대해서 알아 보겠다.
Prometheus의 웹 페이지에서 쿼리를 실행해 원하는 metric을 그래프로 시각화할 수 있다. 하지만 매번 모니터링을 위해 수동으로 쿼리를 실행하는 것은 비효율적이고 기본적으로 제공하는 대시보드 또한 간단하게 그래프를 볼 수 있는 정도이다.
Prometheus가 제공하는 것만으로는 시각화하는데 한계가 있기 때문에 보통 별도의 시각화 도구를 이용해서 metric들을 모니터링한다.
그라파나 역시 여기를 참고하였다면 프로메테우스랑 같이 설치되어 있을 것이다.
Grafana 로그인
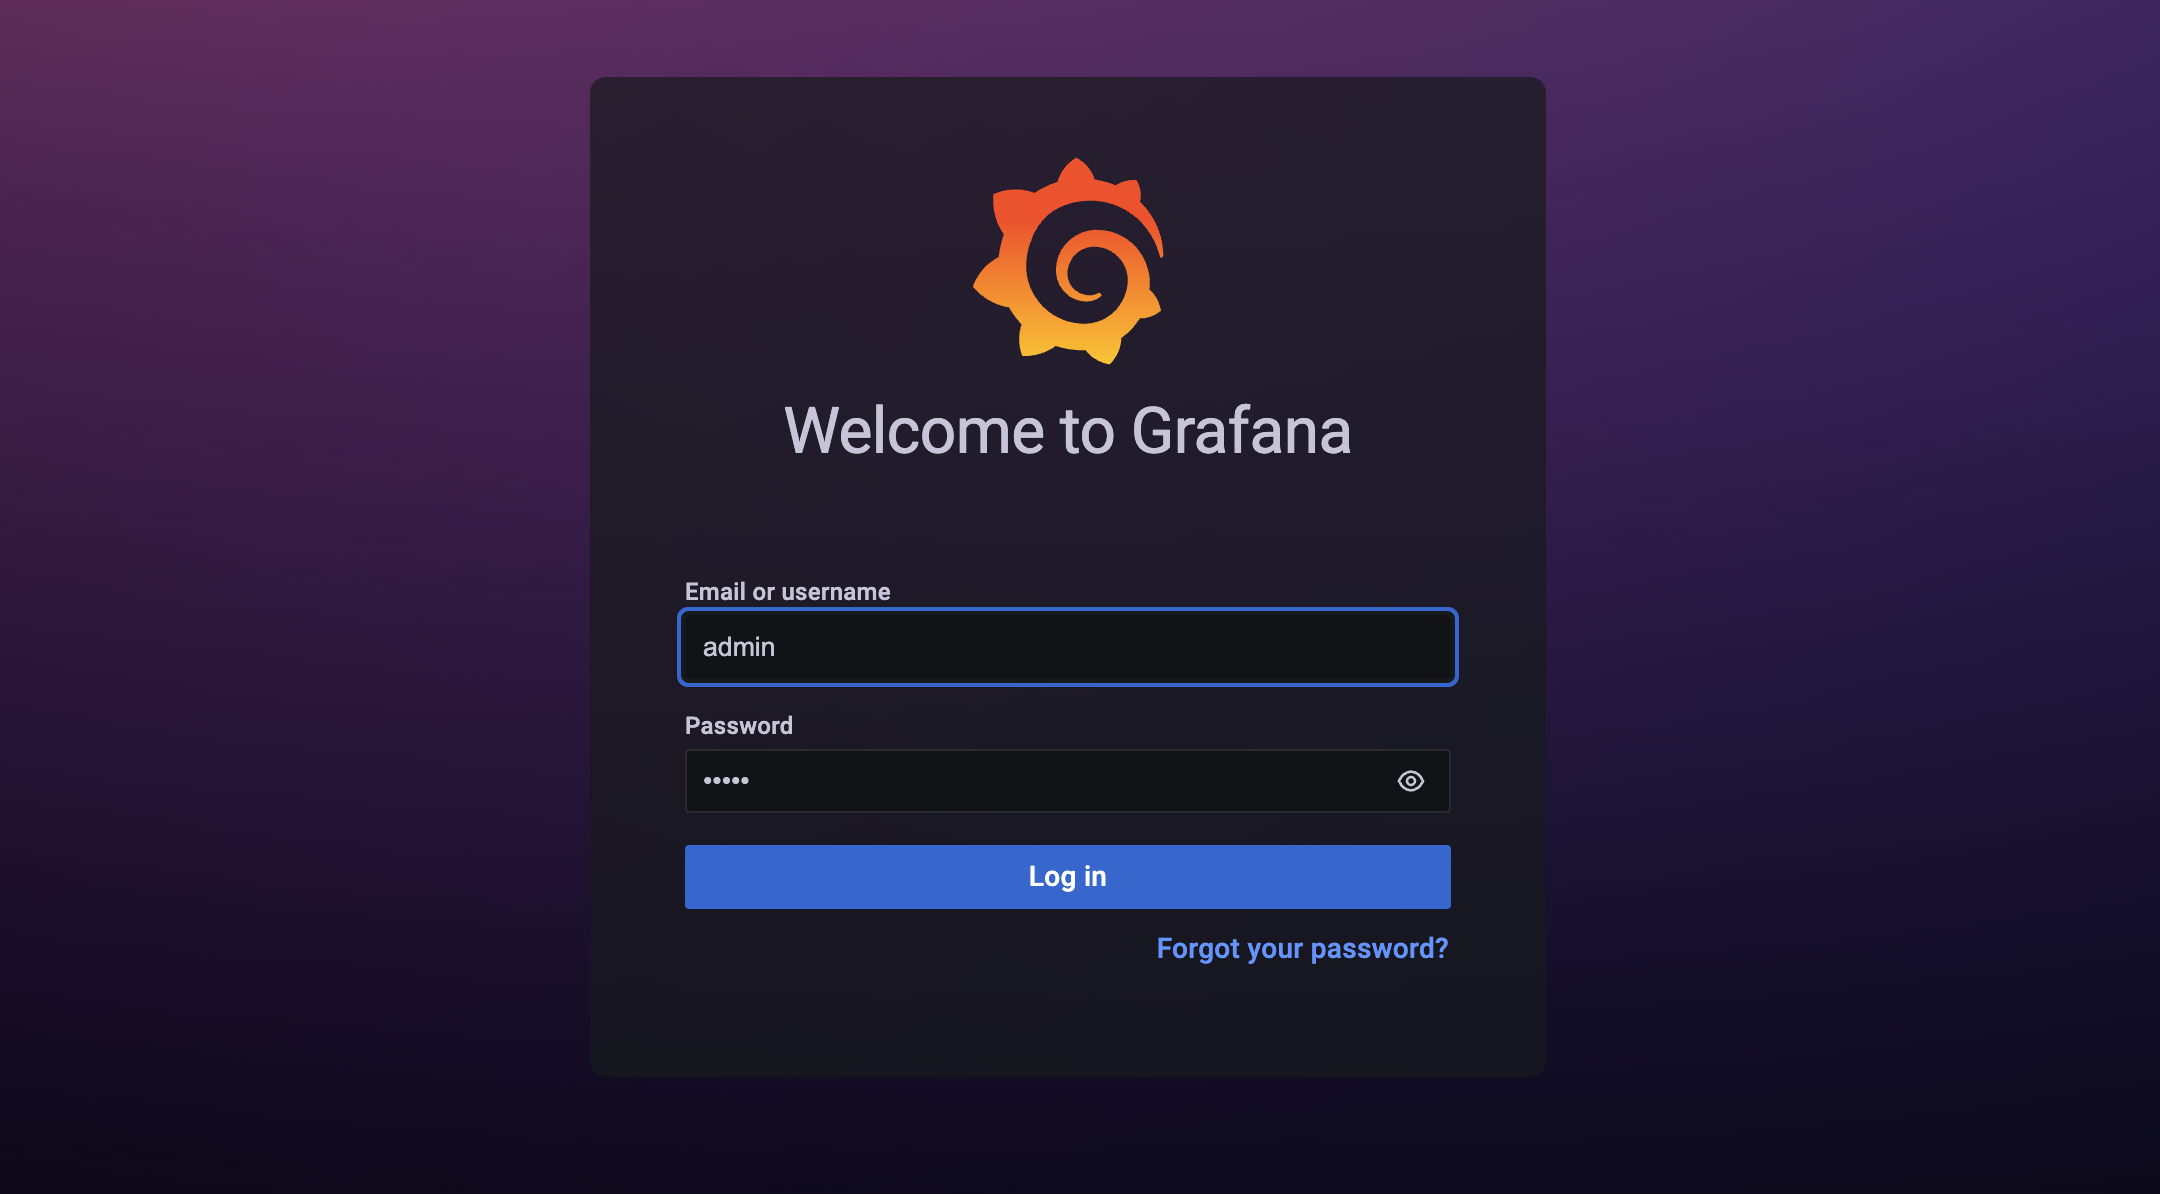
먼저 Grafana(http://localhost:9090)에 접속해 보면, 다음과 같이 Grafana의 메인 화면으로 로그인 화면을 확인할 수 있다.
기본으로 설정된 계정 정보(ID/PW)인 admin/admin으로 로그인을 할 수 있다.
Grafana 데이터 소스 추가
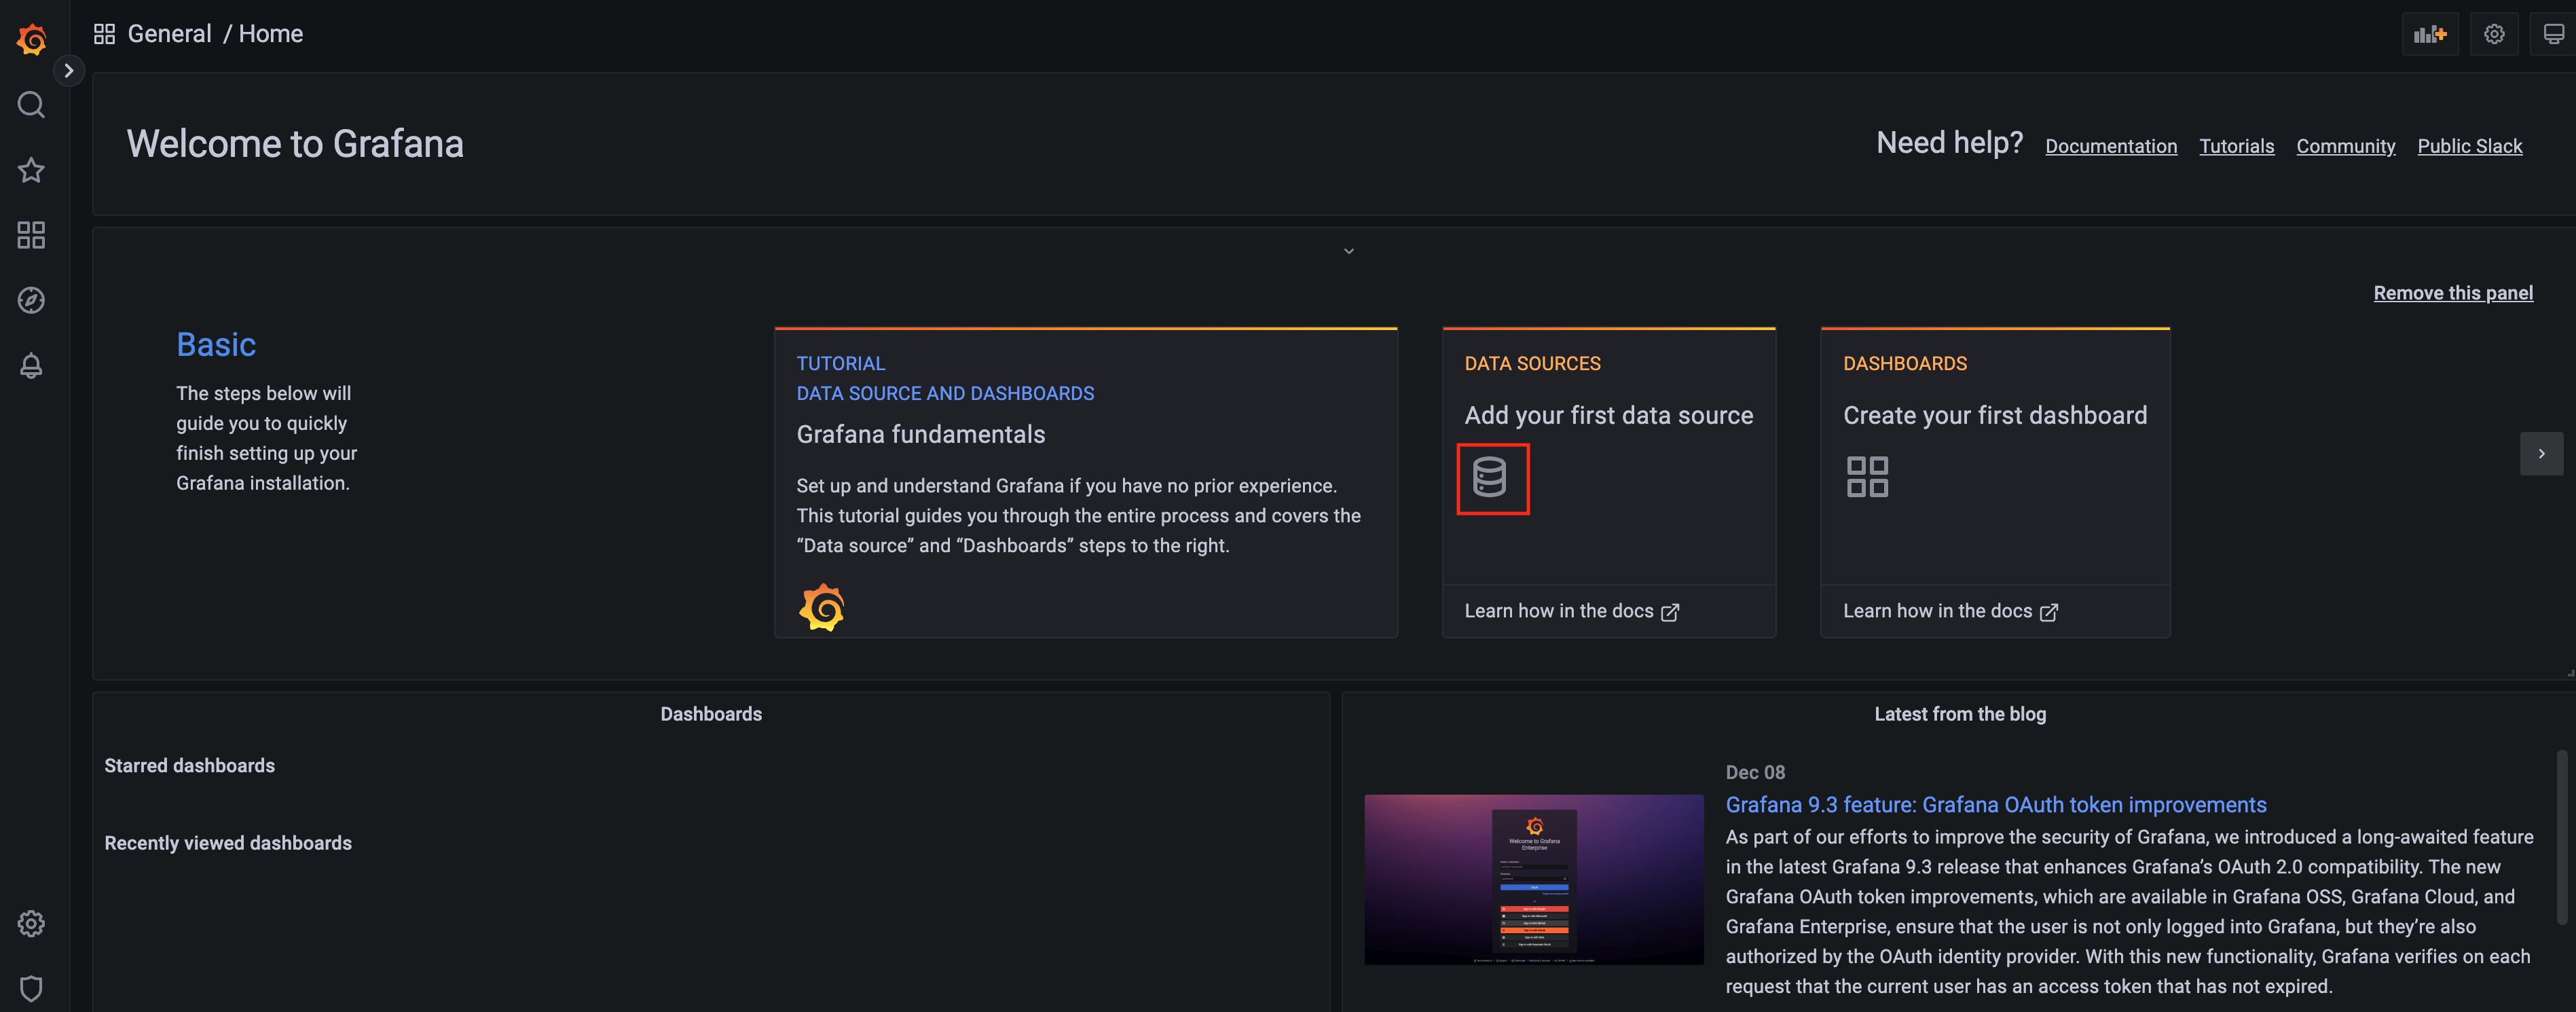
로그인을 하면 아래와 같은 첫 화면이 나오고, 여기서 DATA SOURCES에 아이콘을 클릭한다.
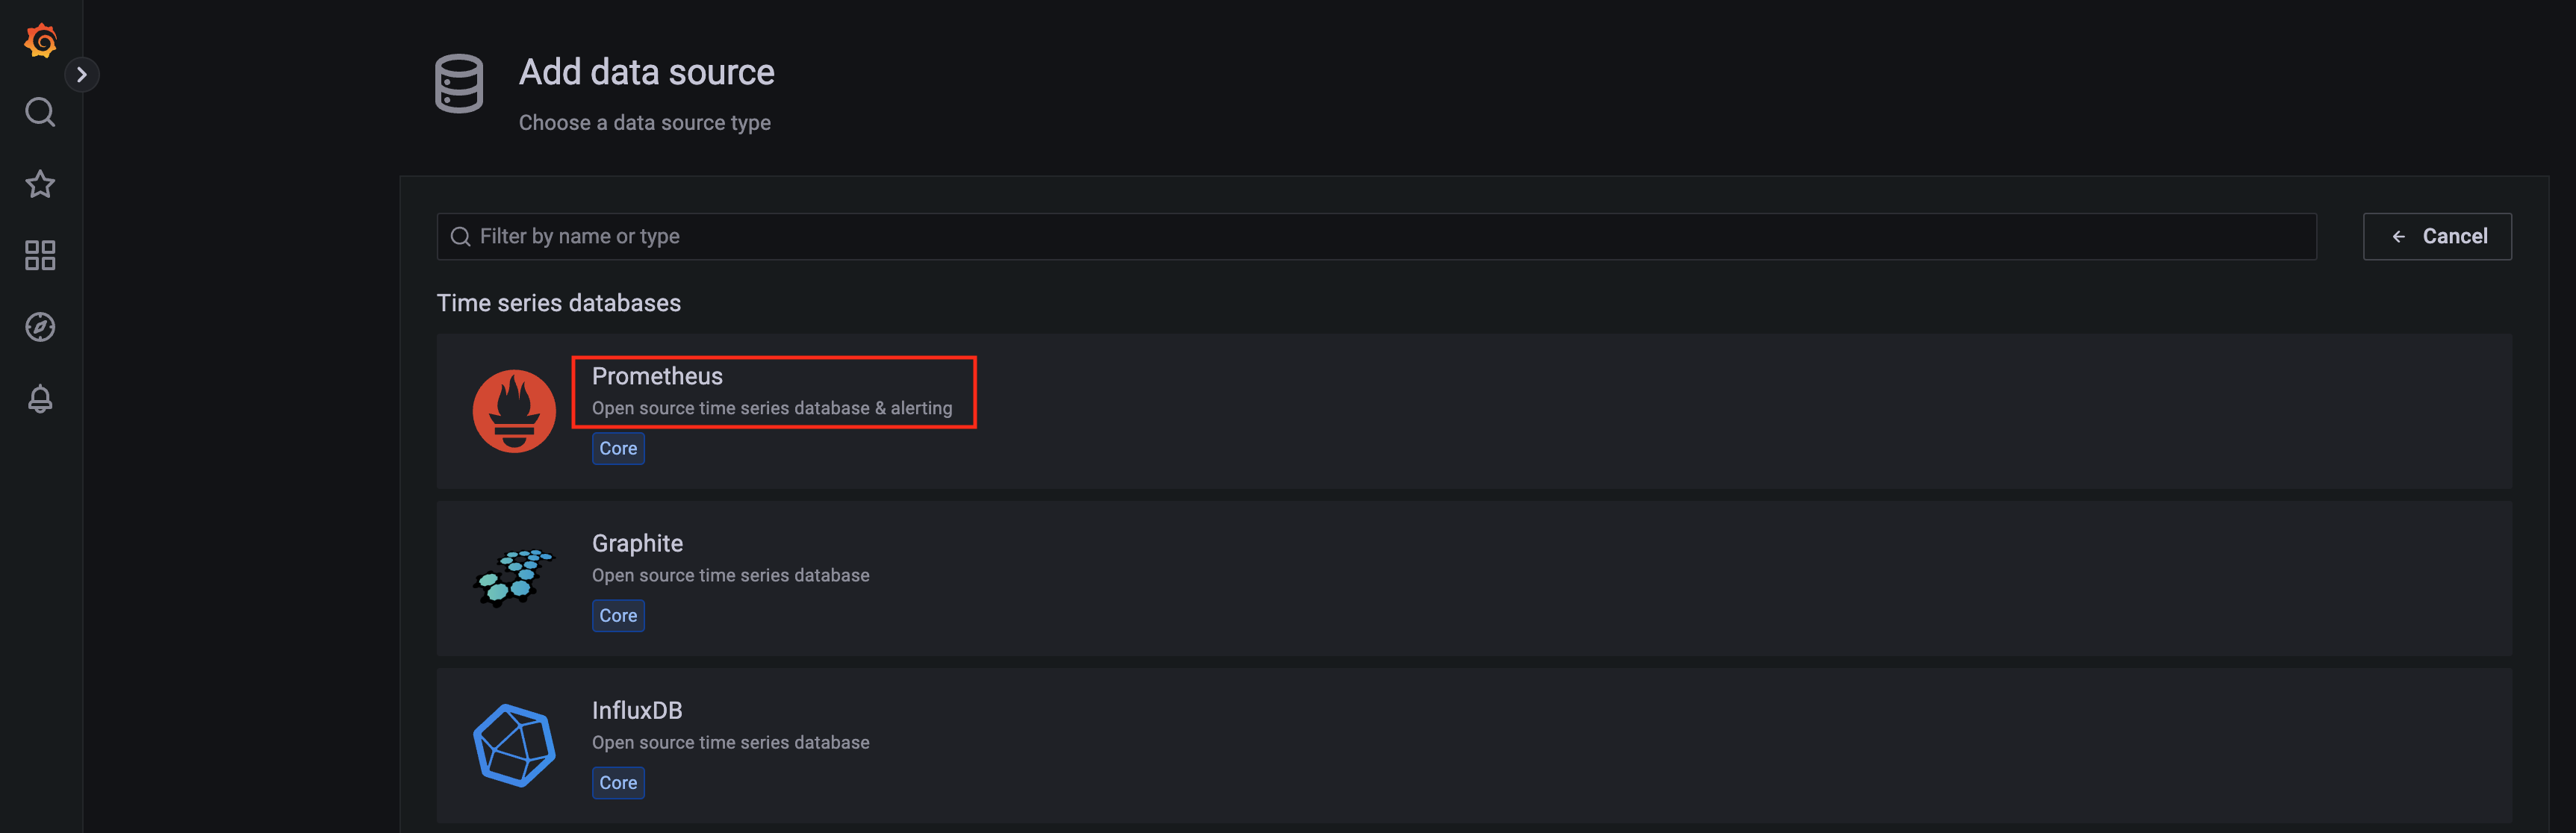
추가할 Data Source에서 Prometheus를 클릭한다.
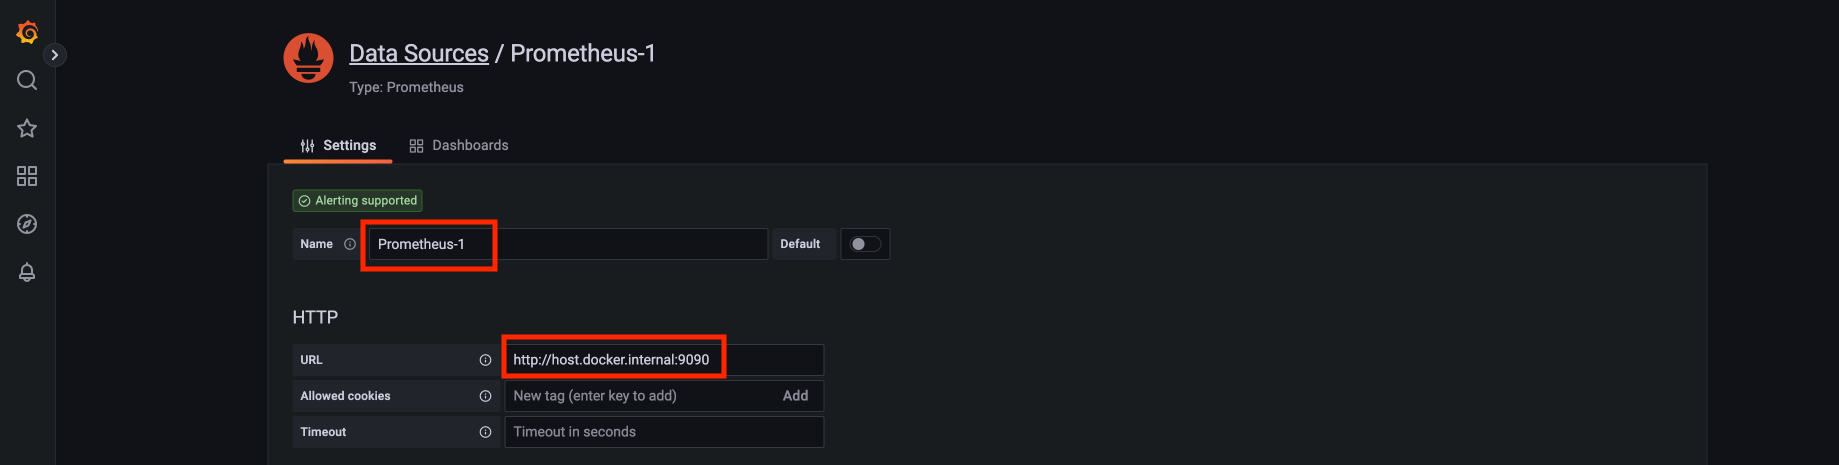
Prometheus의 Data Source 소스를 추가 화면이 나오면, “Name”, “URL"를 입력한다.
Name에는 본인이 원하는 이름으로 입력하고, URL에는 “http://host.docker.internal:9090"을 입력하면 된다.
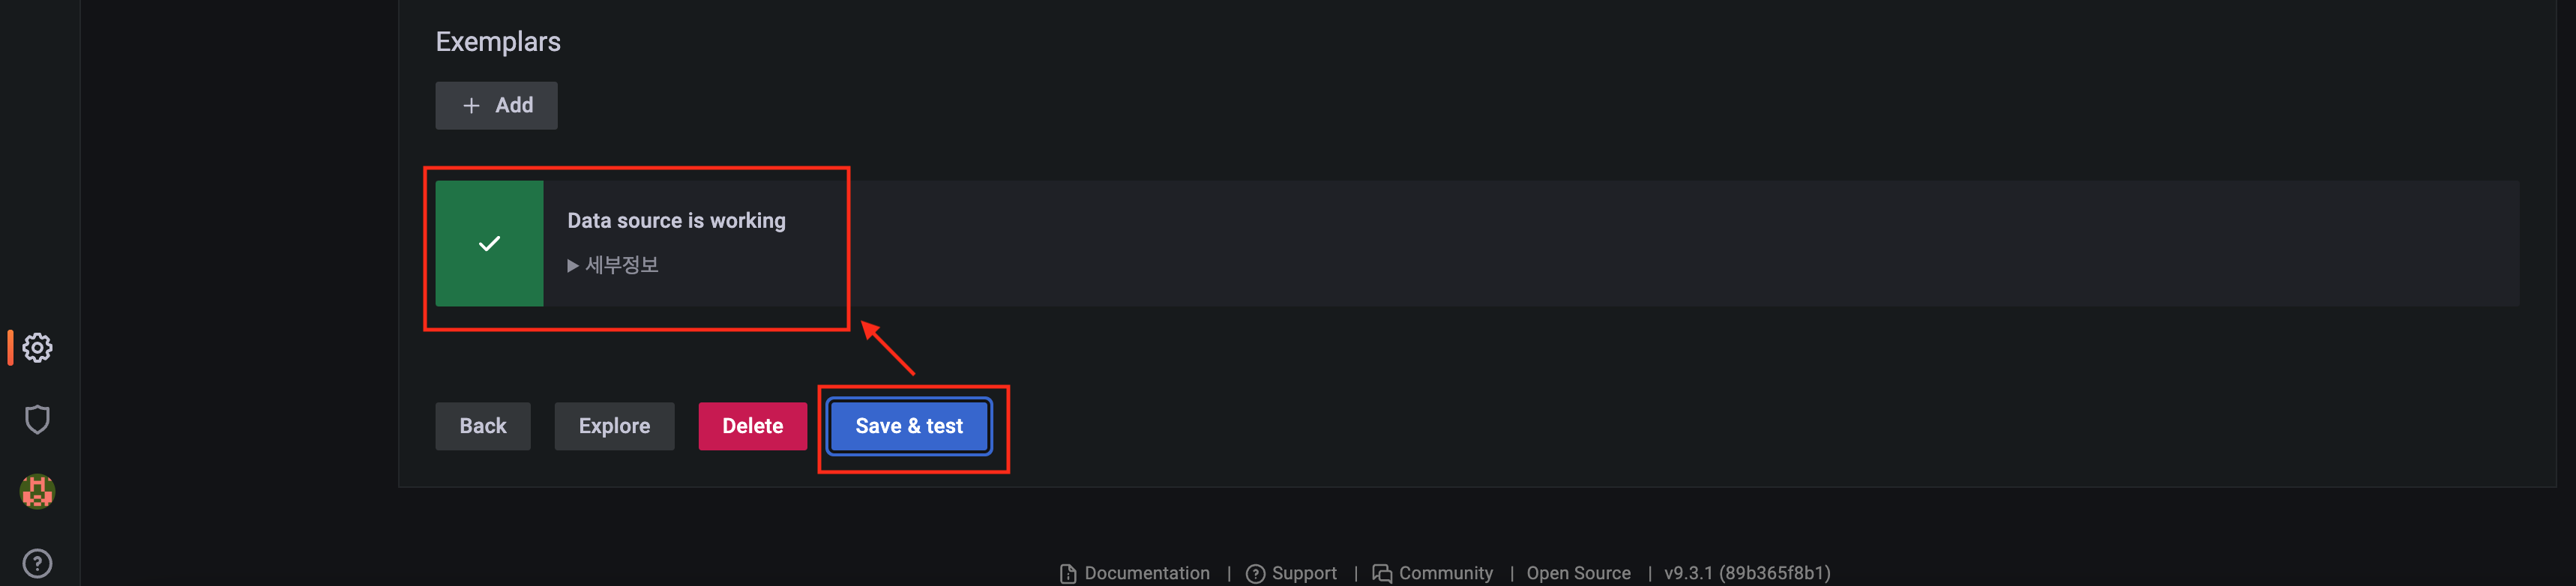
아래로 스크롤로 이동하여 “Save & test” 버튼을 클릭하면, 성공 메세지(Data source is working)이라는 메세지가 표시가 된다.
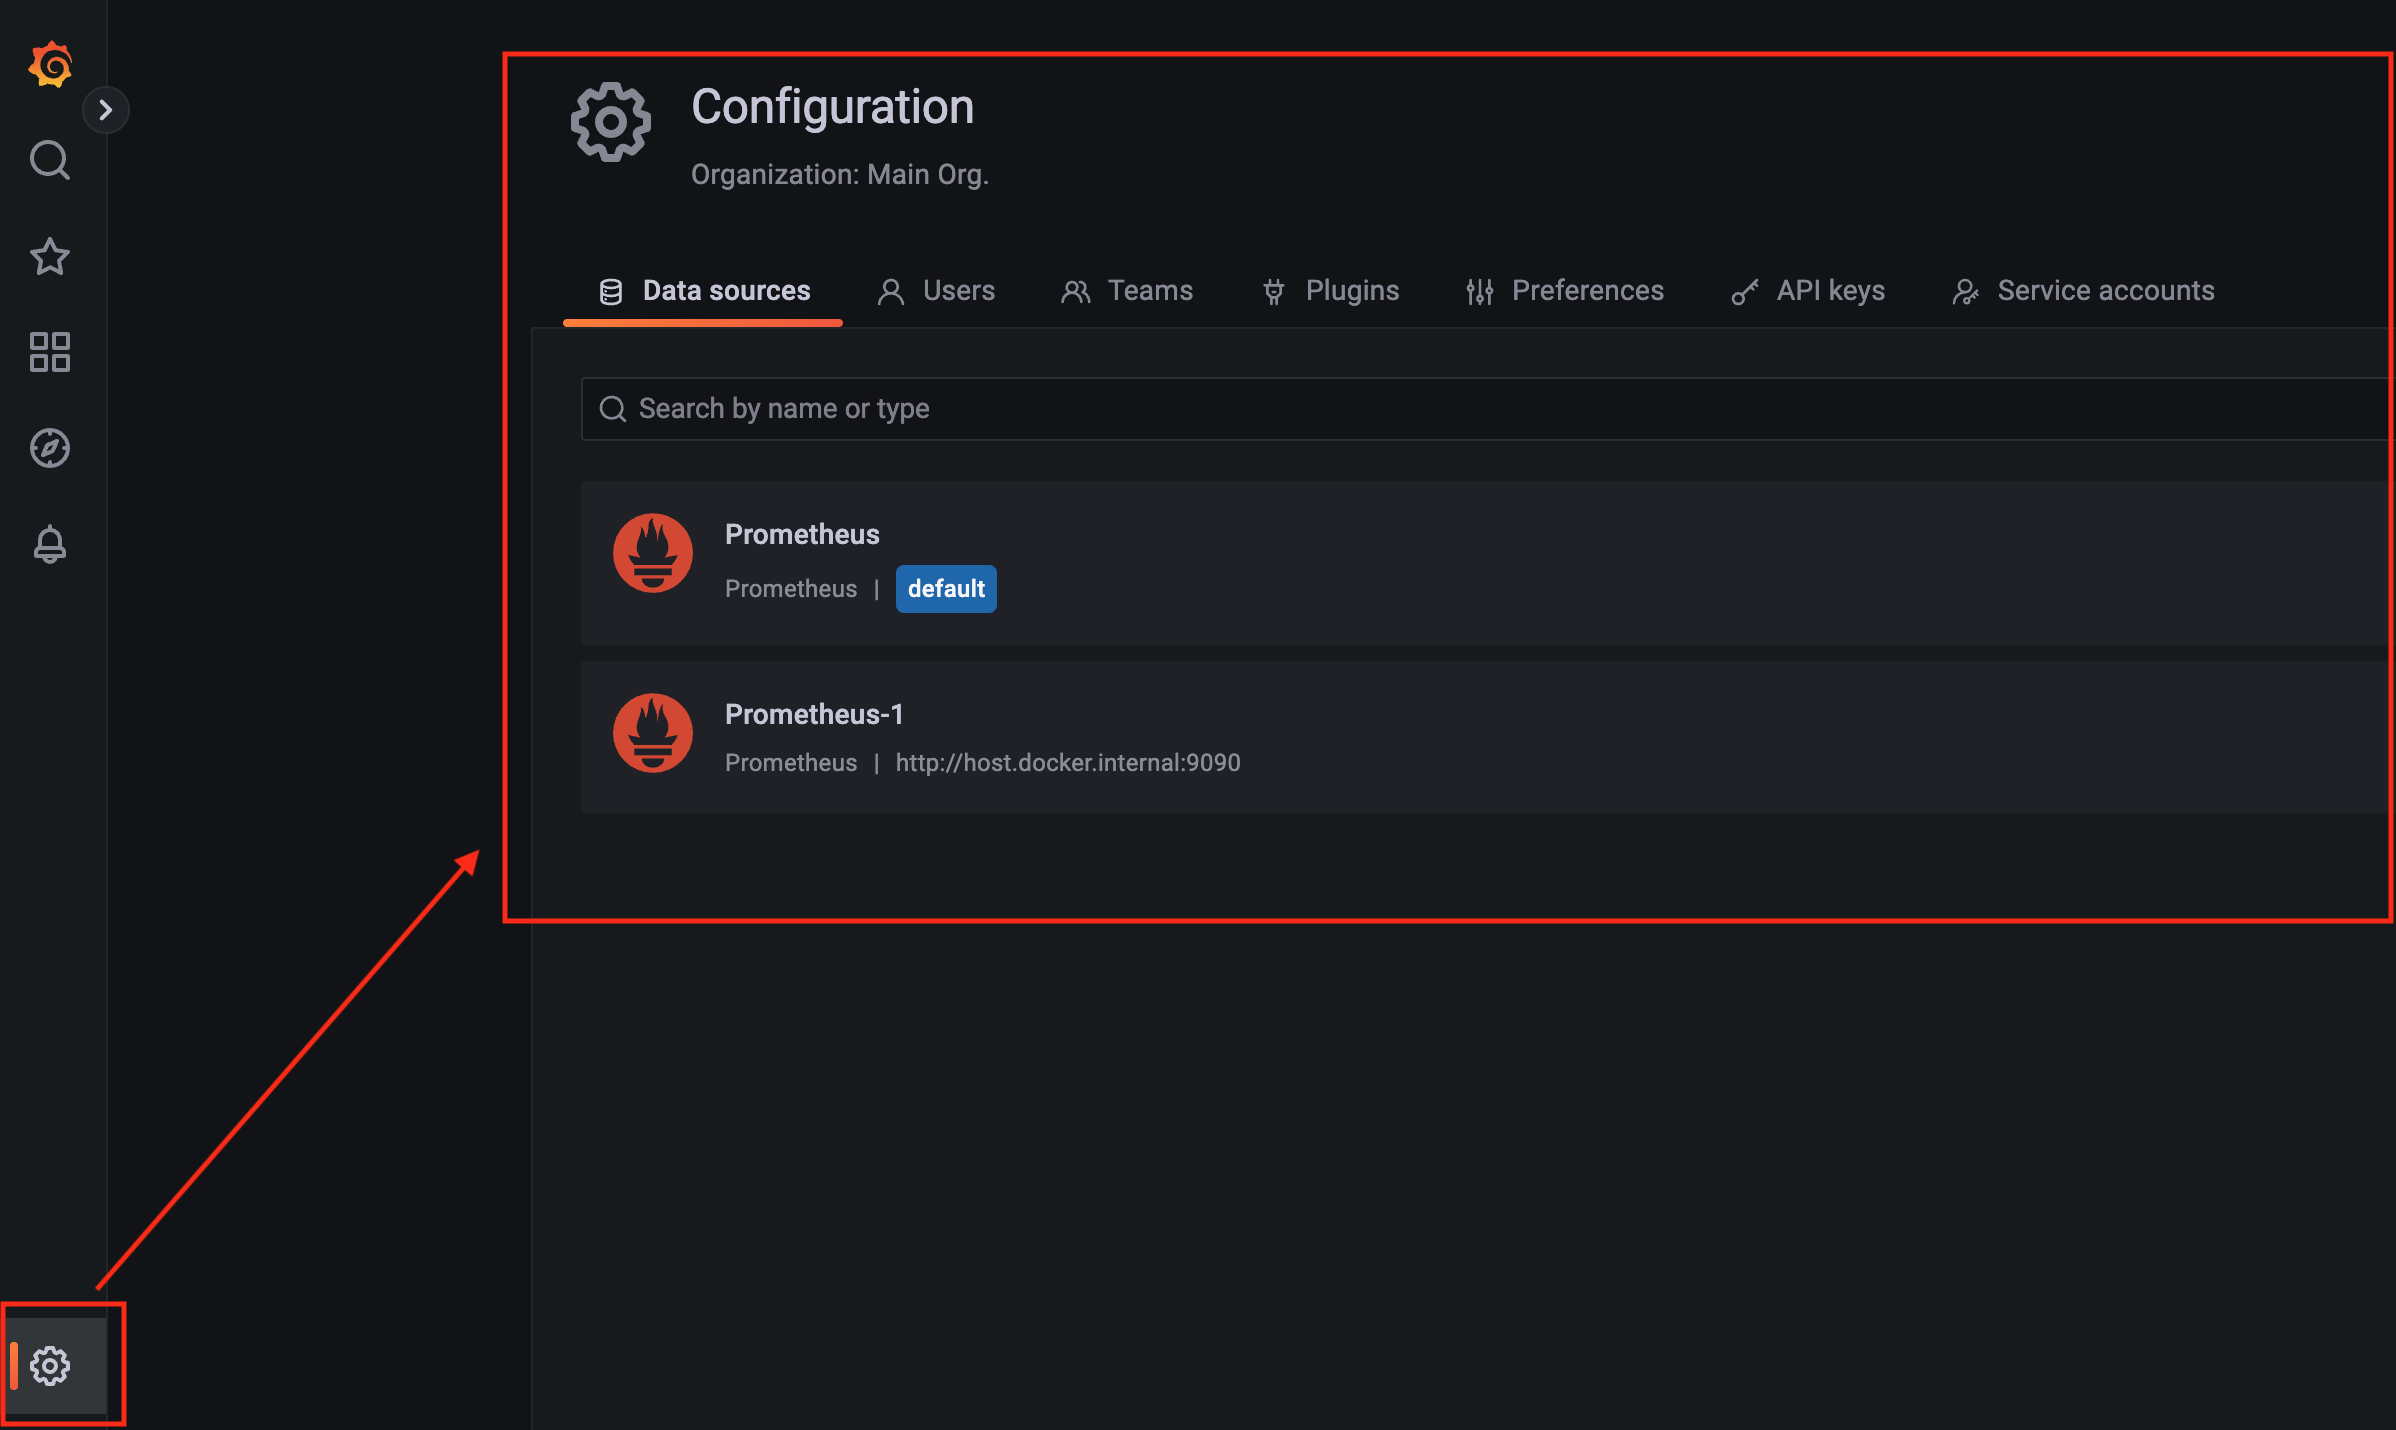
Configuration 아이콘을 누르면 방금전에 등록한 Data sources를 확인 할 수 있다.
Grafana Metric 그래프 차트 추가
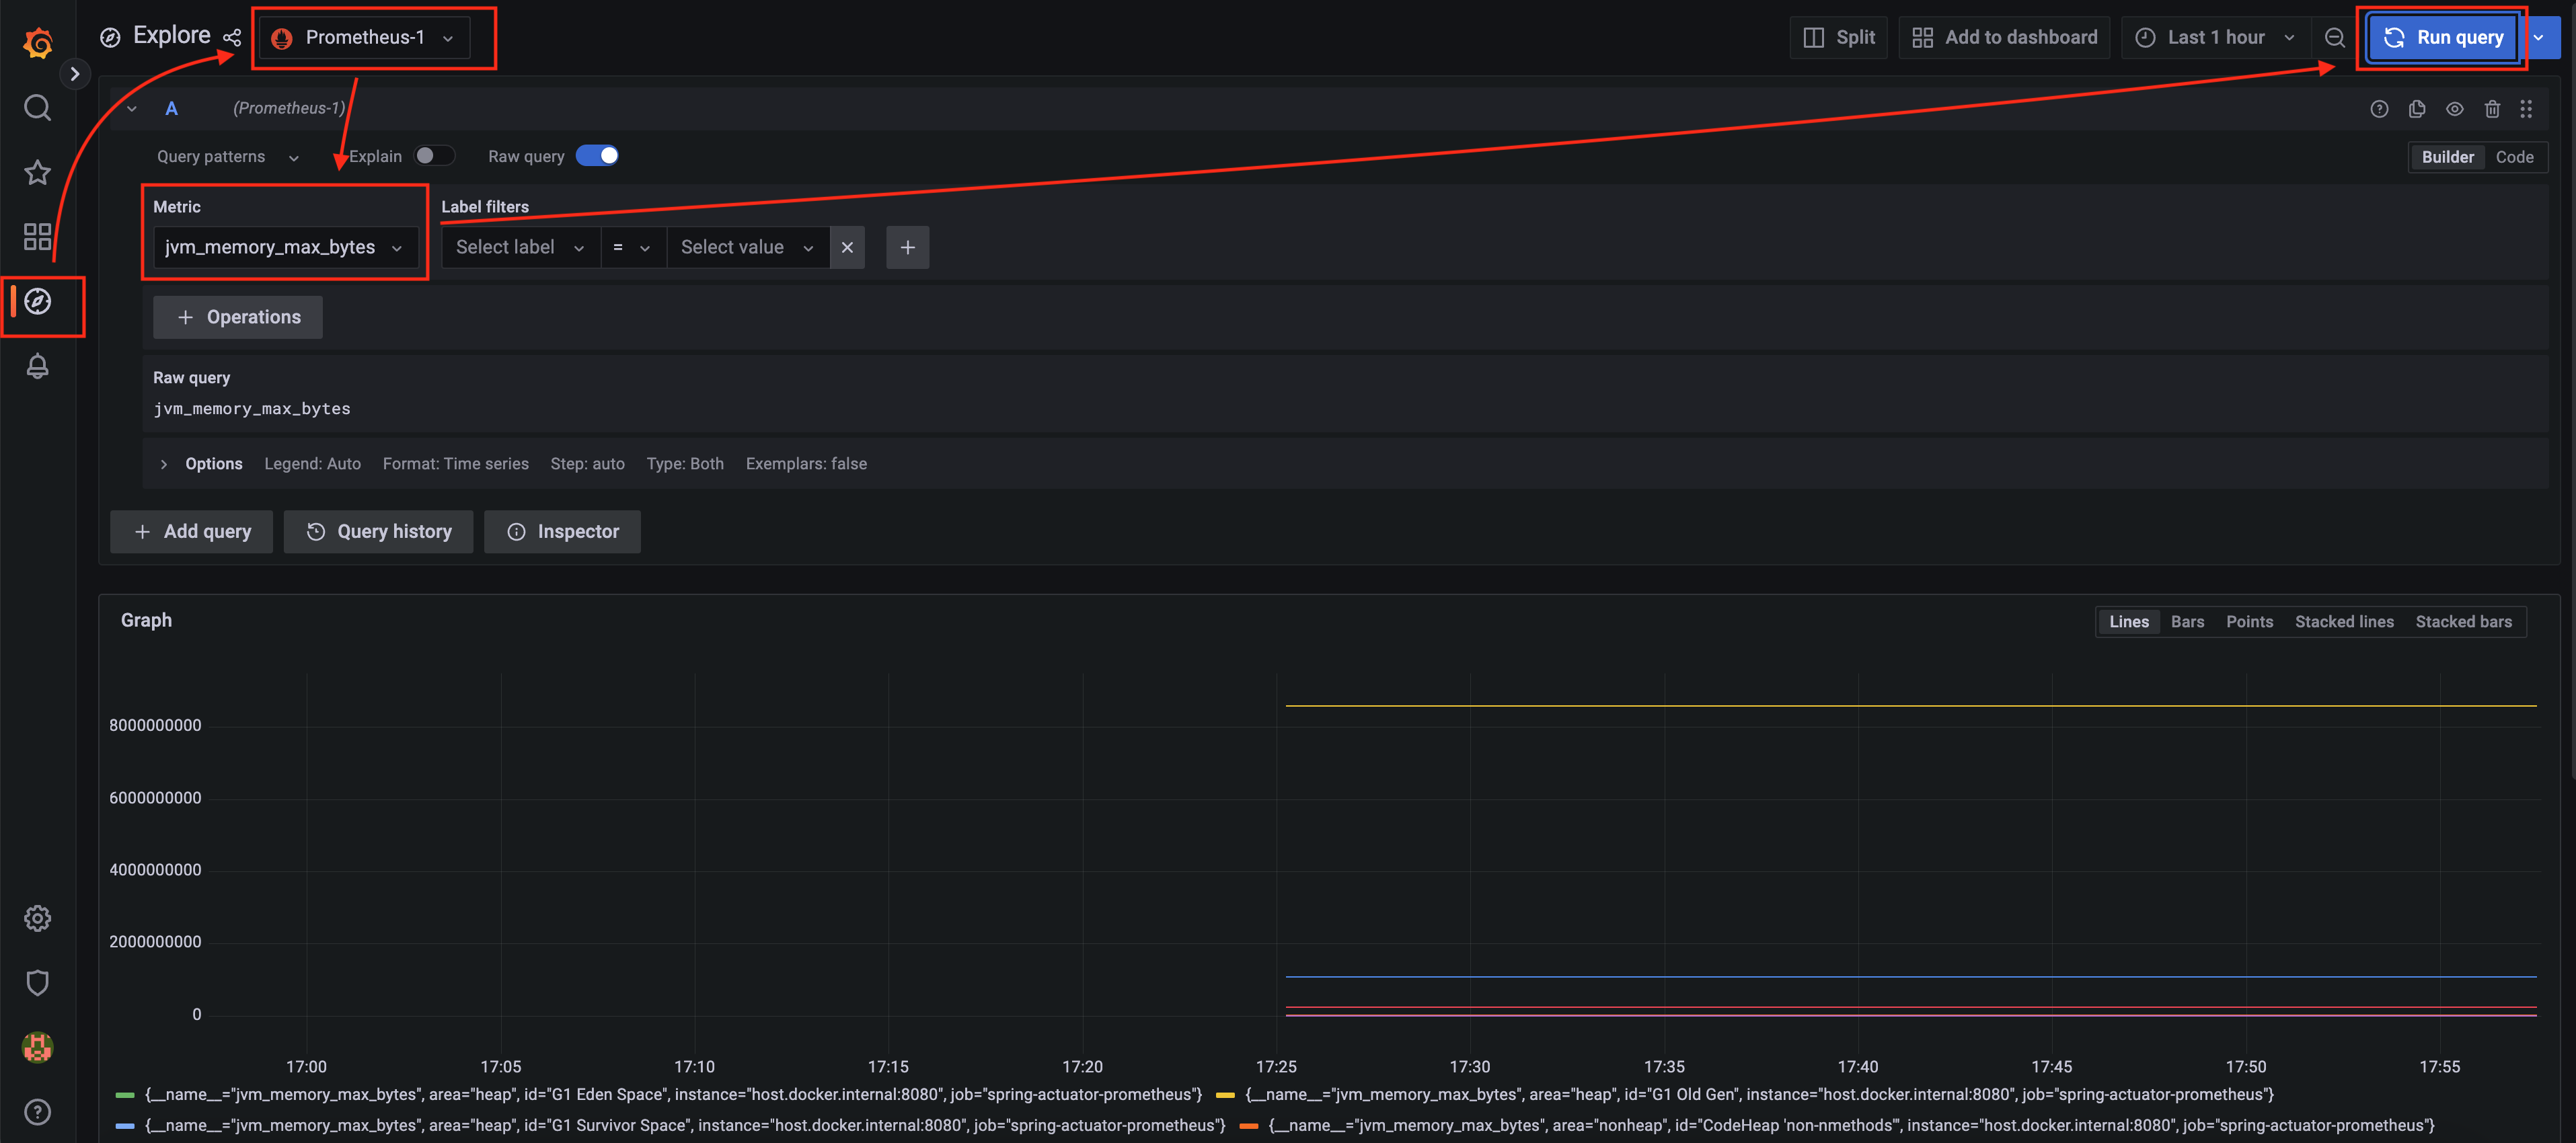
그러고, Explore 아이콘을 눌려서 “Metric"에는 jvm_memory_max_bytes를 선택하고, “Run query” 버튼을 누른다.
그러면 아래와 같이 그래프 차트를 볼수 있을 것이다.
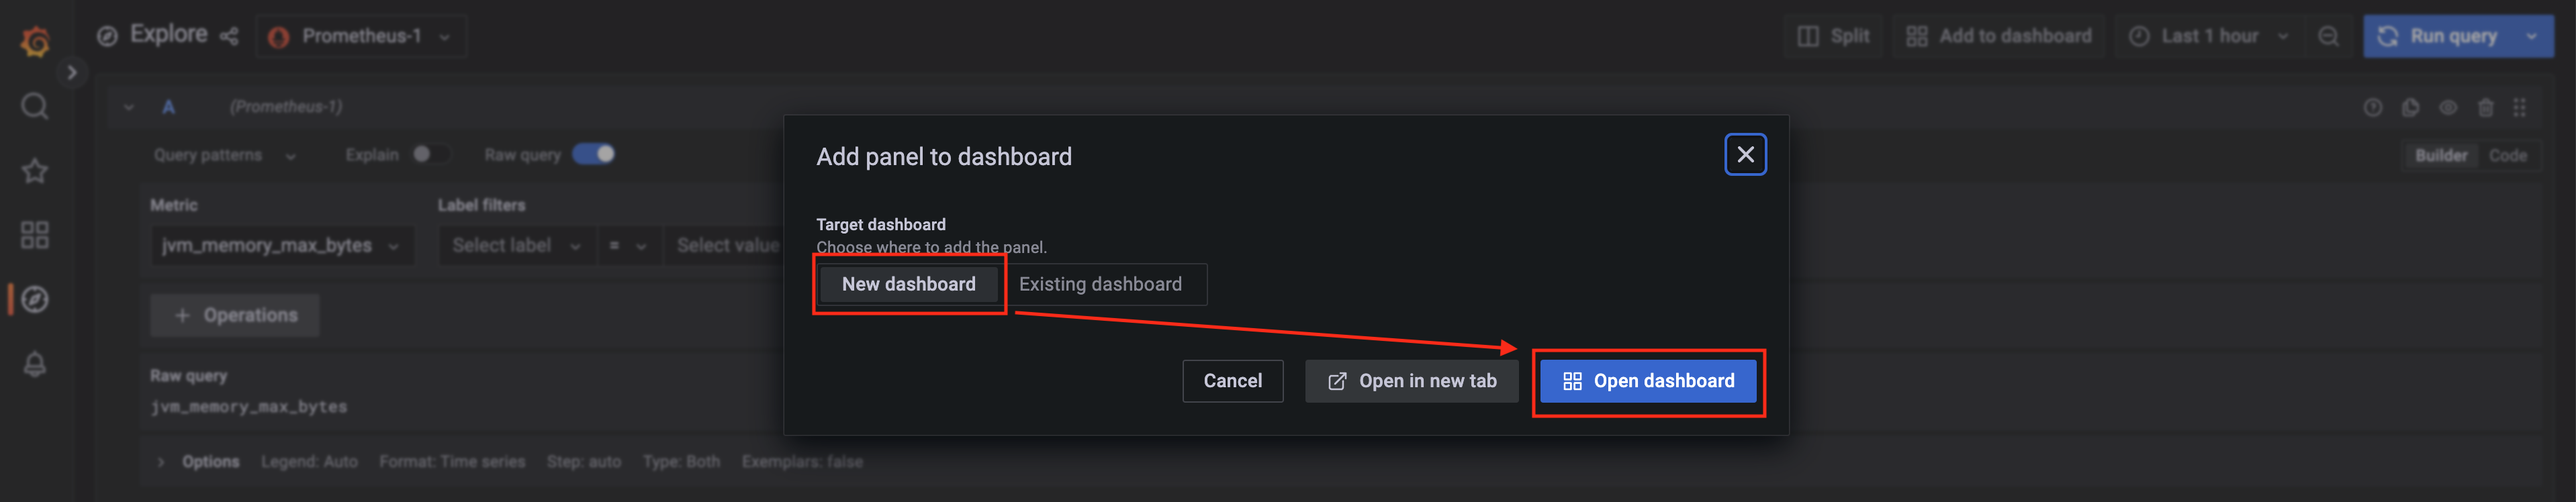
“Add to dashboard” 버튼을 누르면, “Add panel to dashboard” 화면이 나온다.
여기서 “New dashboard"를 선택하고, “Open dashboard” 버튼을 누른다.
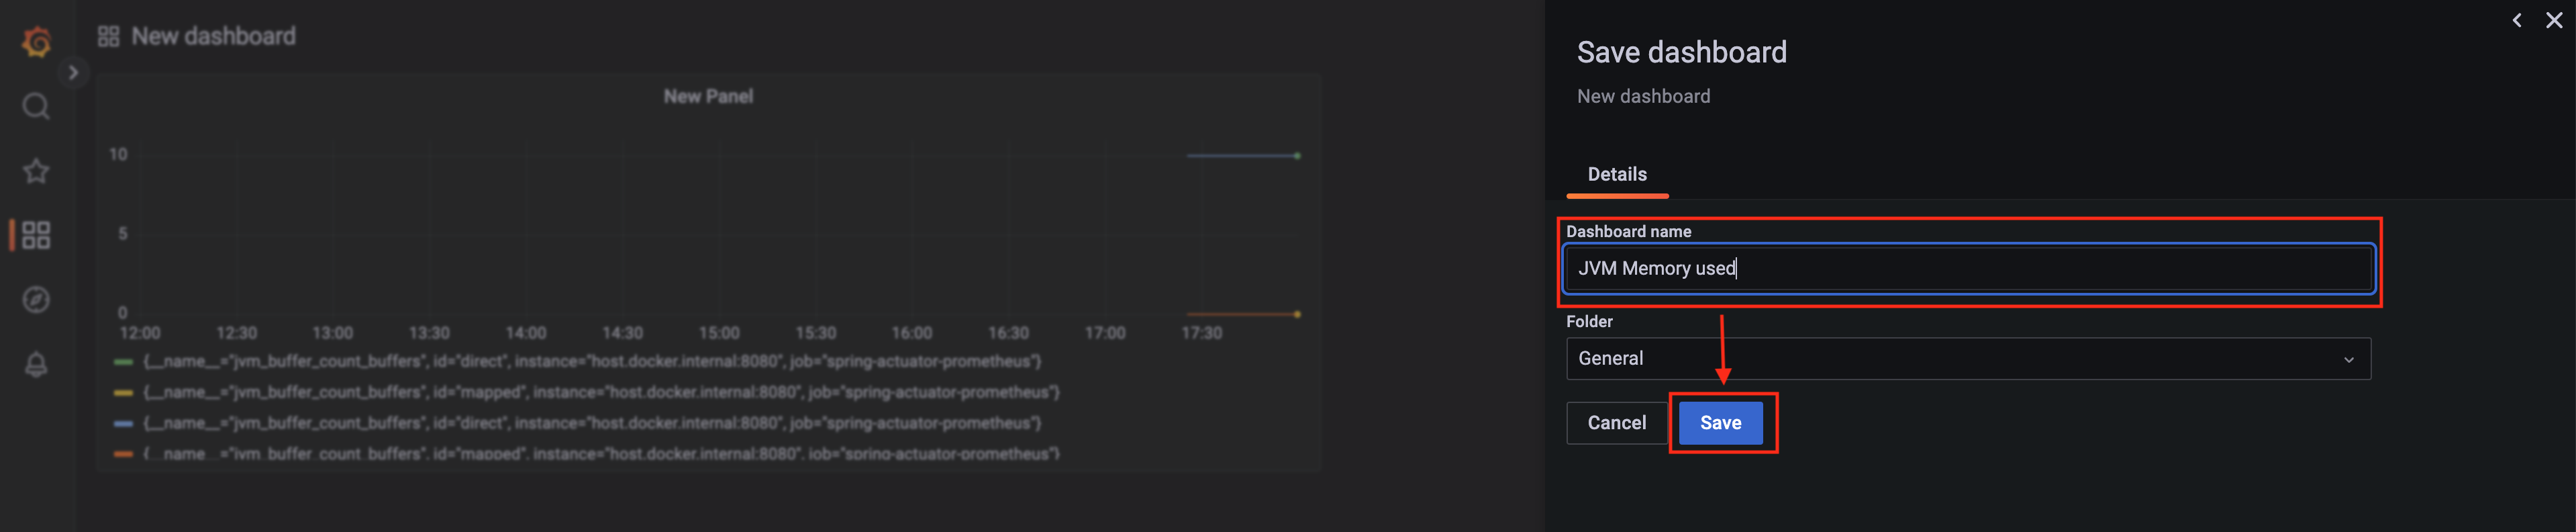
“Save dashboard” 화면에서 “Dashboard name"을 입력해서 “Save” 버튼을 눌려서 저장한다.
이제는 왼쪽에 Dashboard 아이콘을 클릭하고 아까 입력한 이름의 “JVM Memory used” 항목을 선택한다.
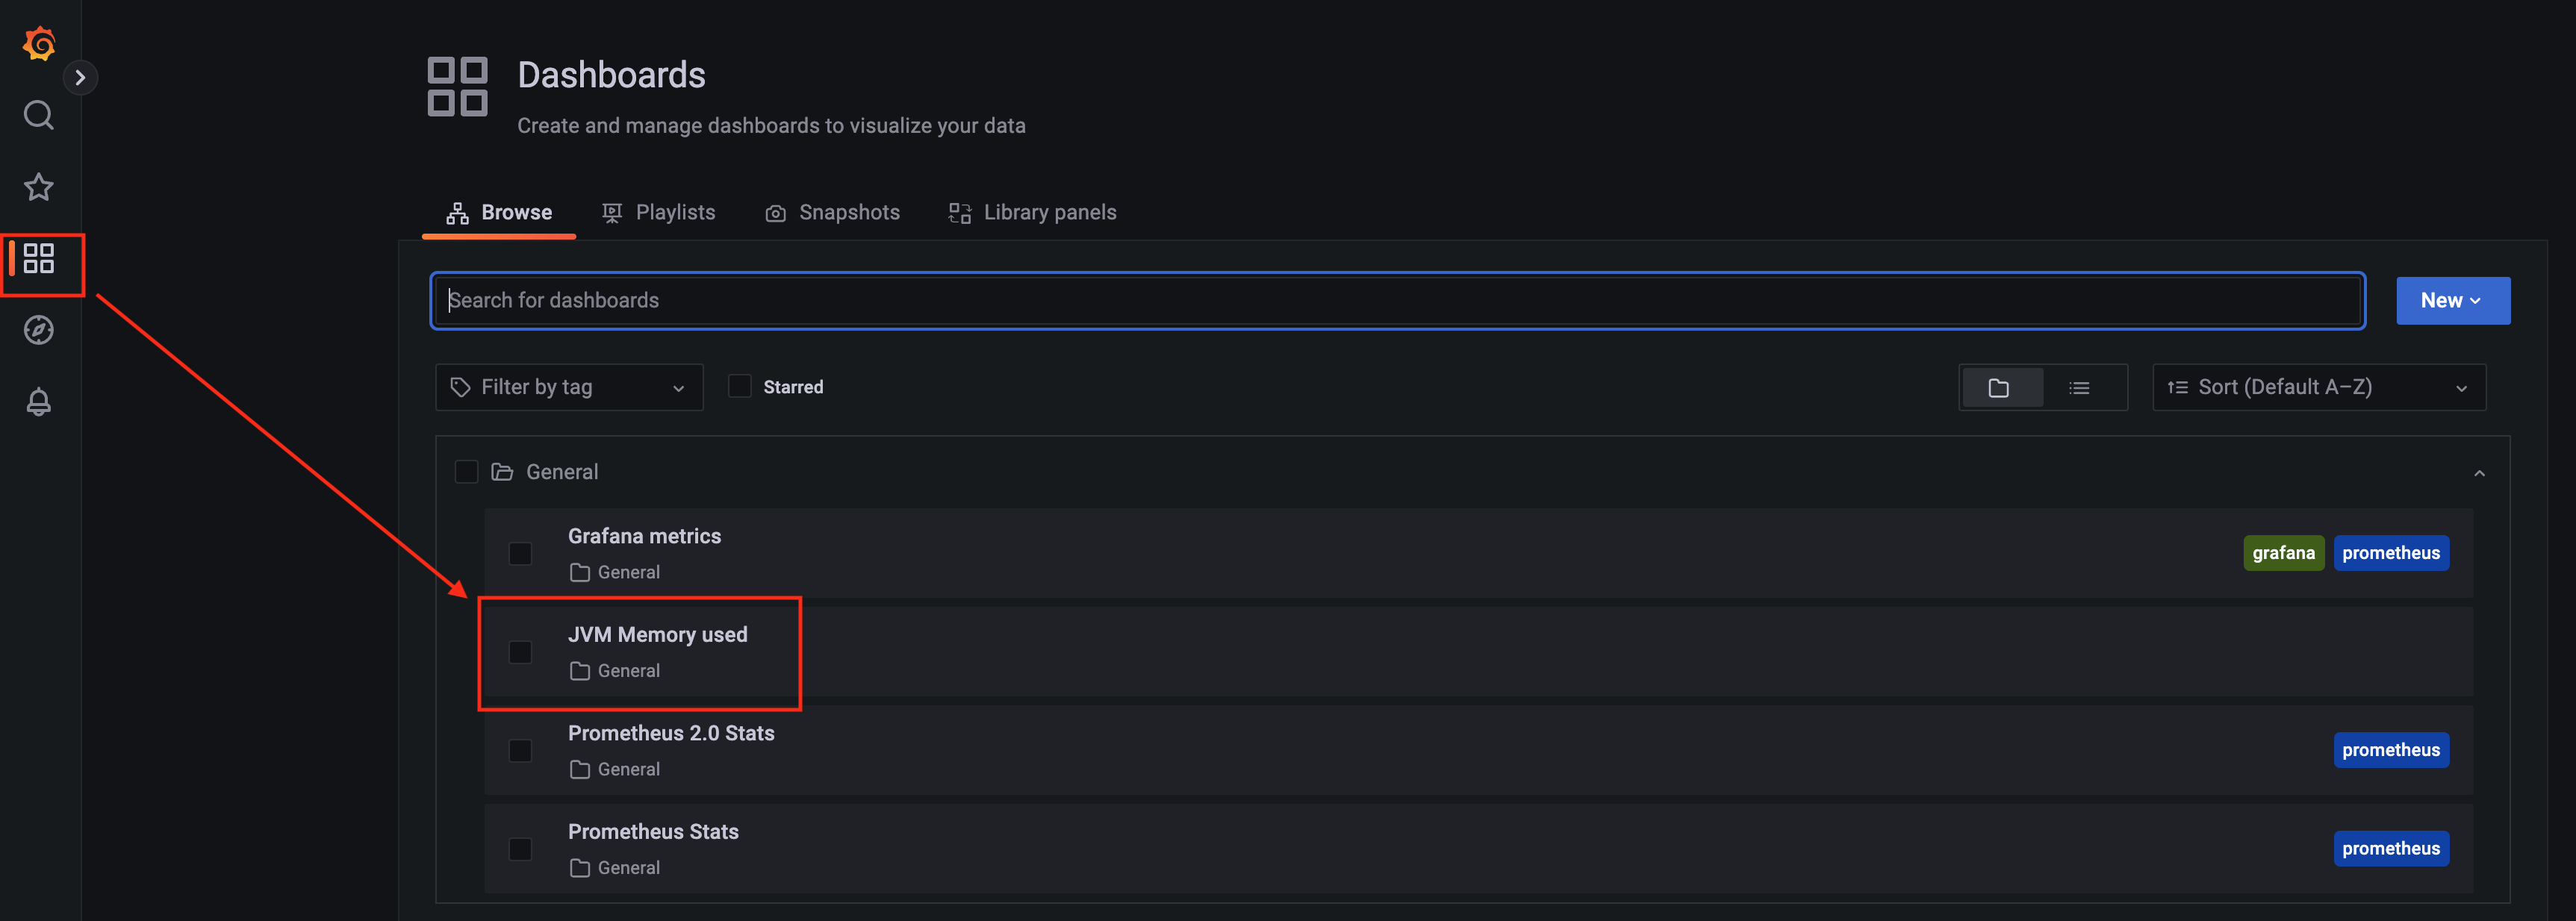
그러면, 아래 같이 차트를 볼수 있다.
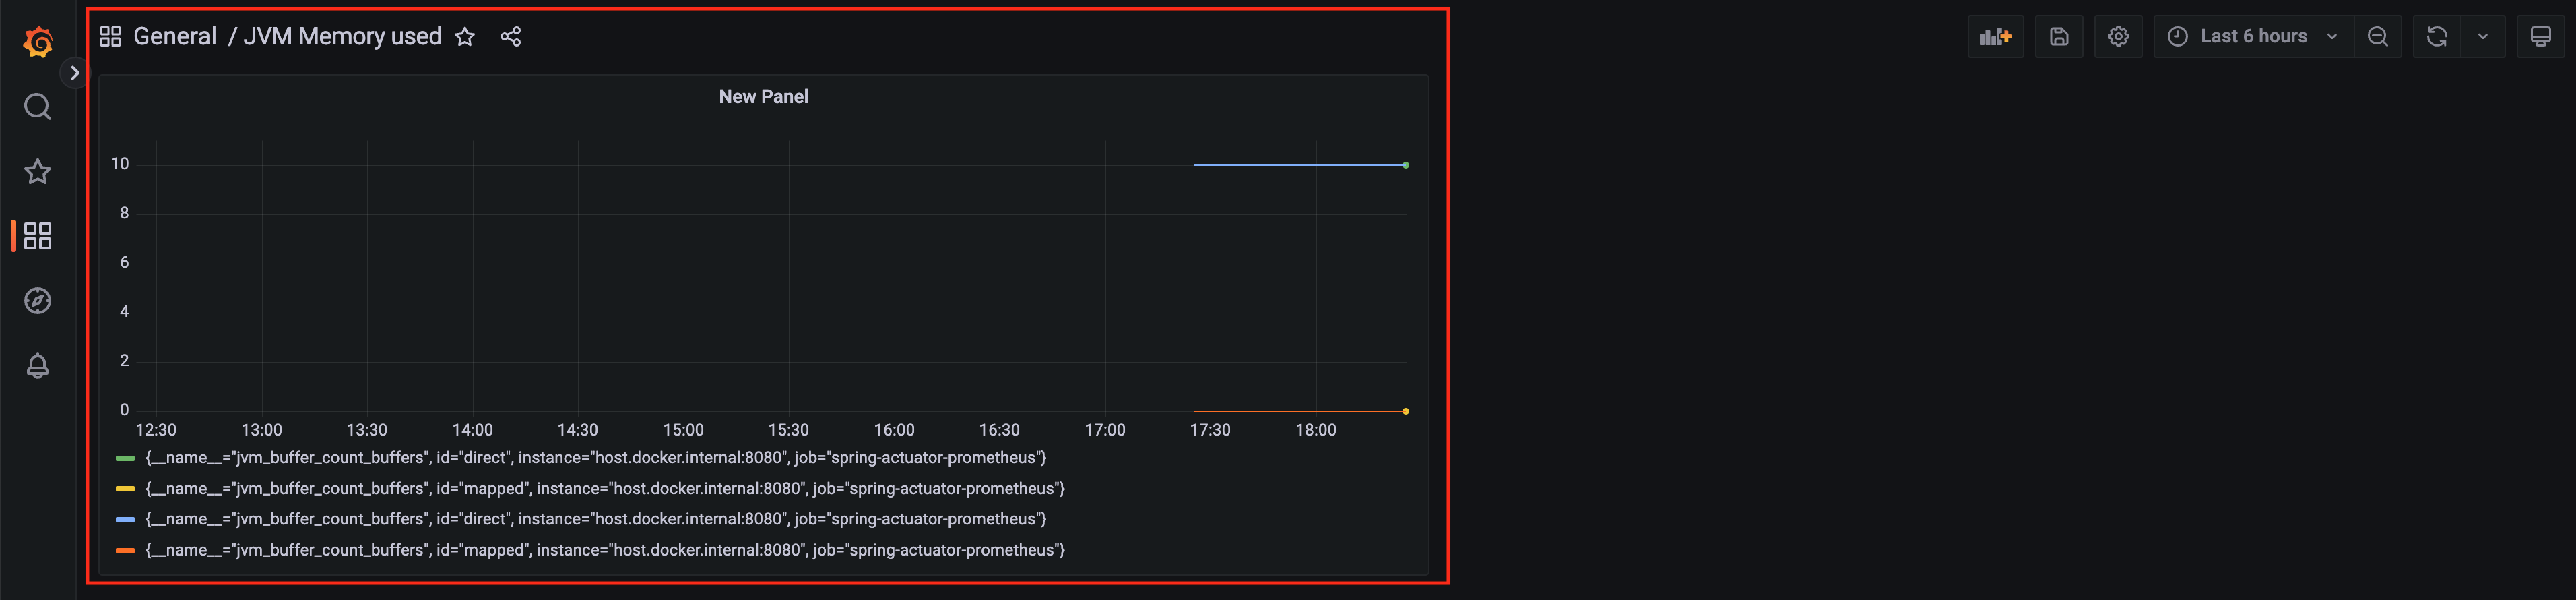
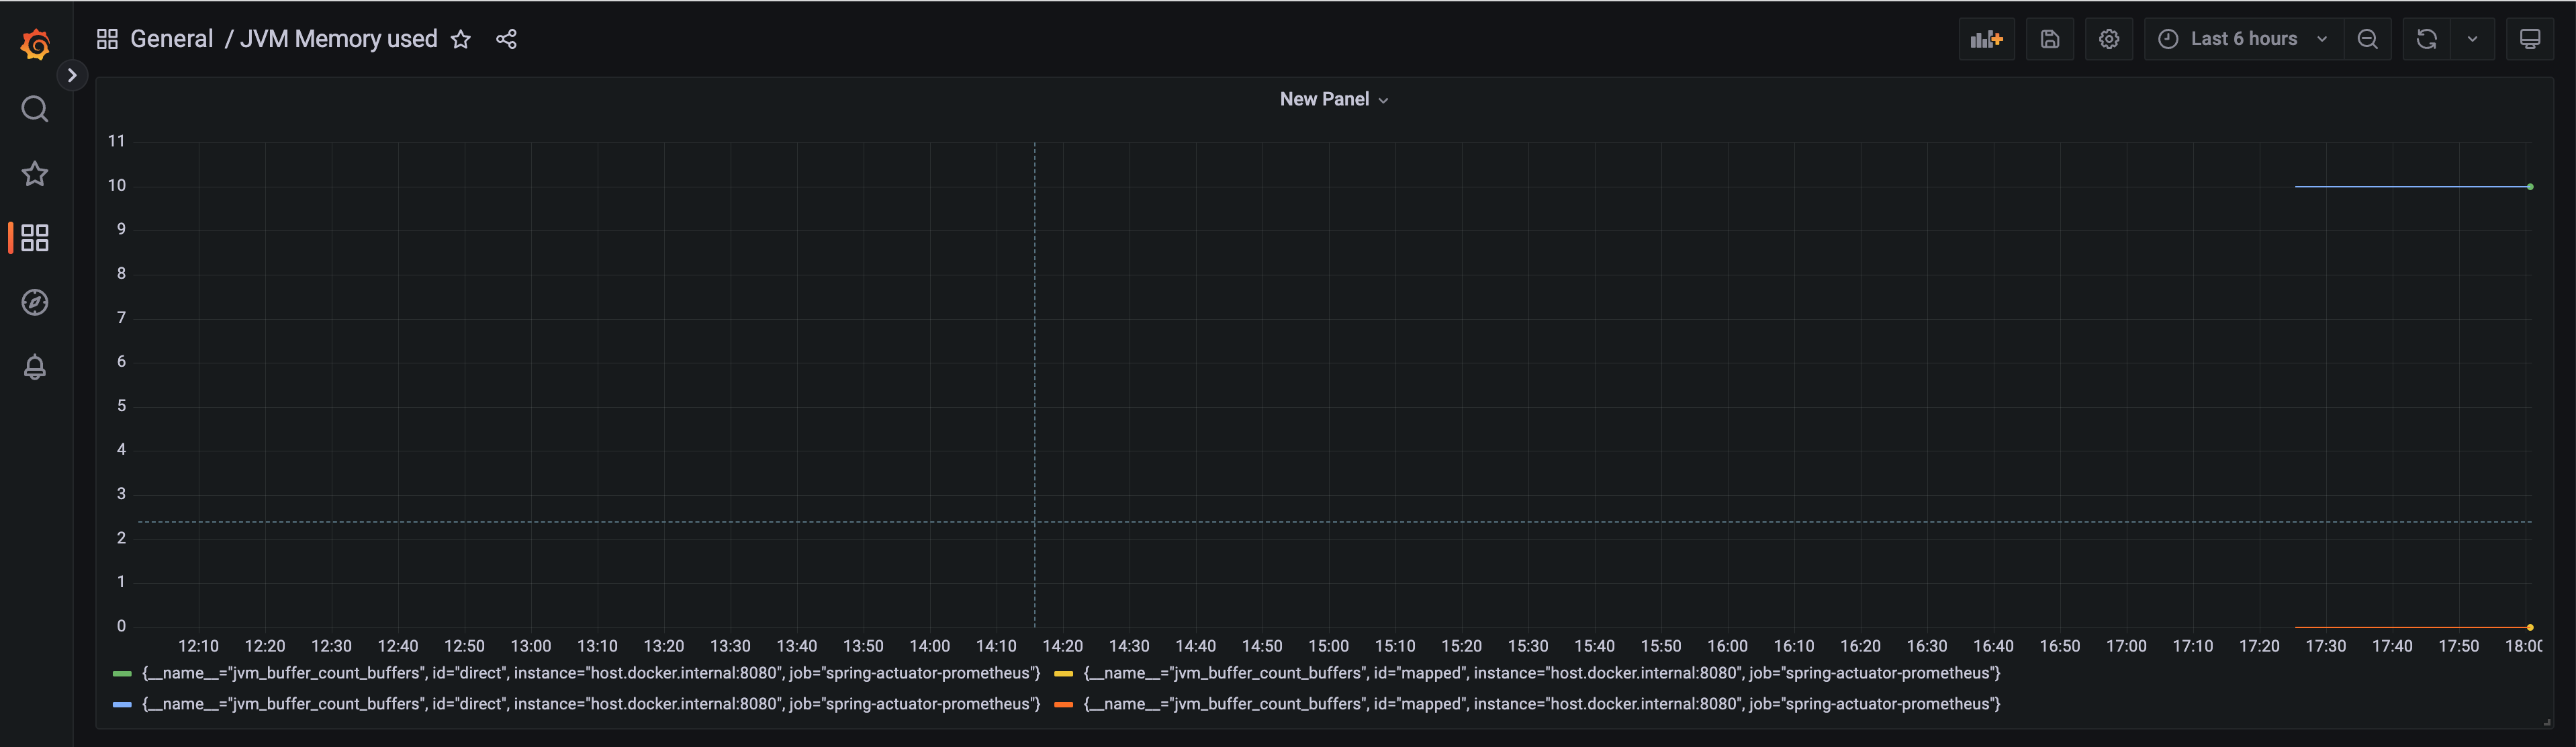
이 차트를 옆으로 마우스로 늘리면, 늘어나고 저장도 할 수 있다.
참조
- 위에 모두 완성된 프로젝트 코드는 여기에 올려 두었다.
- Micrometer Application Monitoring | concepts
- SpringBoot Application의 monitoring 시스템 구축하기