Prometheus를 설치 및 시작
Prometheus를 시작하려면 (prometheus라는) 바이너리를 실행하면 된다. 이상이다.
…. 결론으로서는 이것뿐이지만, 조금은 이것뿐이라고 아무래도 친절하지 않으므로, 데모를 섞어 설명하겠다.
Prometheus 설치 및 시작
우선 브라우저에서 “Prometheus GitHub"를 검색하면 Prometheus의 GitHub가 나온다. 거기에서 Prometheus 리포지토리로 이동하여 Releases 페이지를 연다.
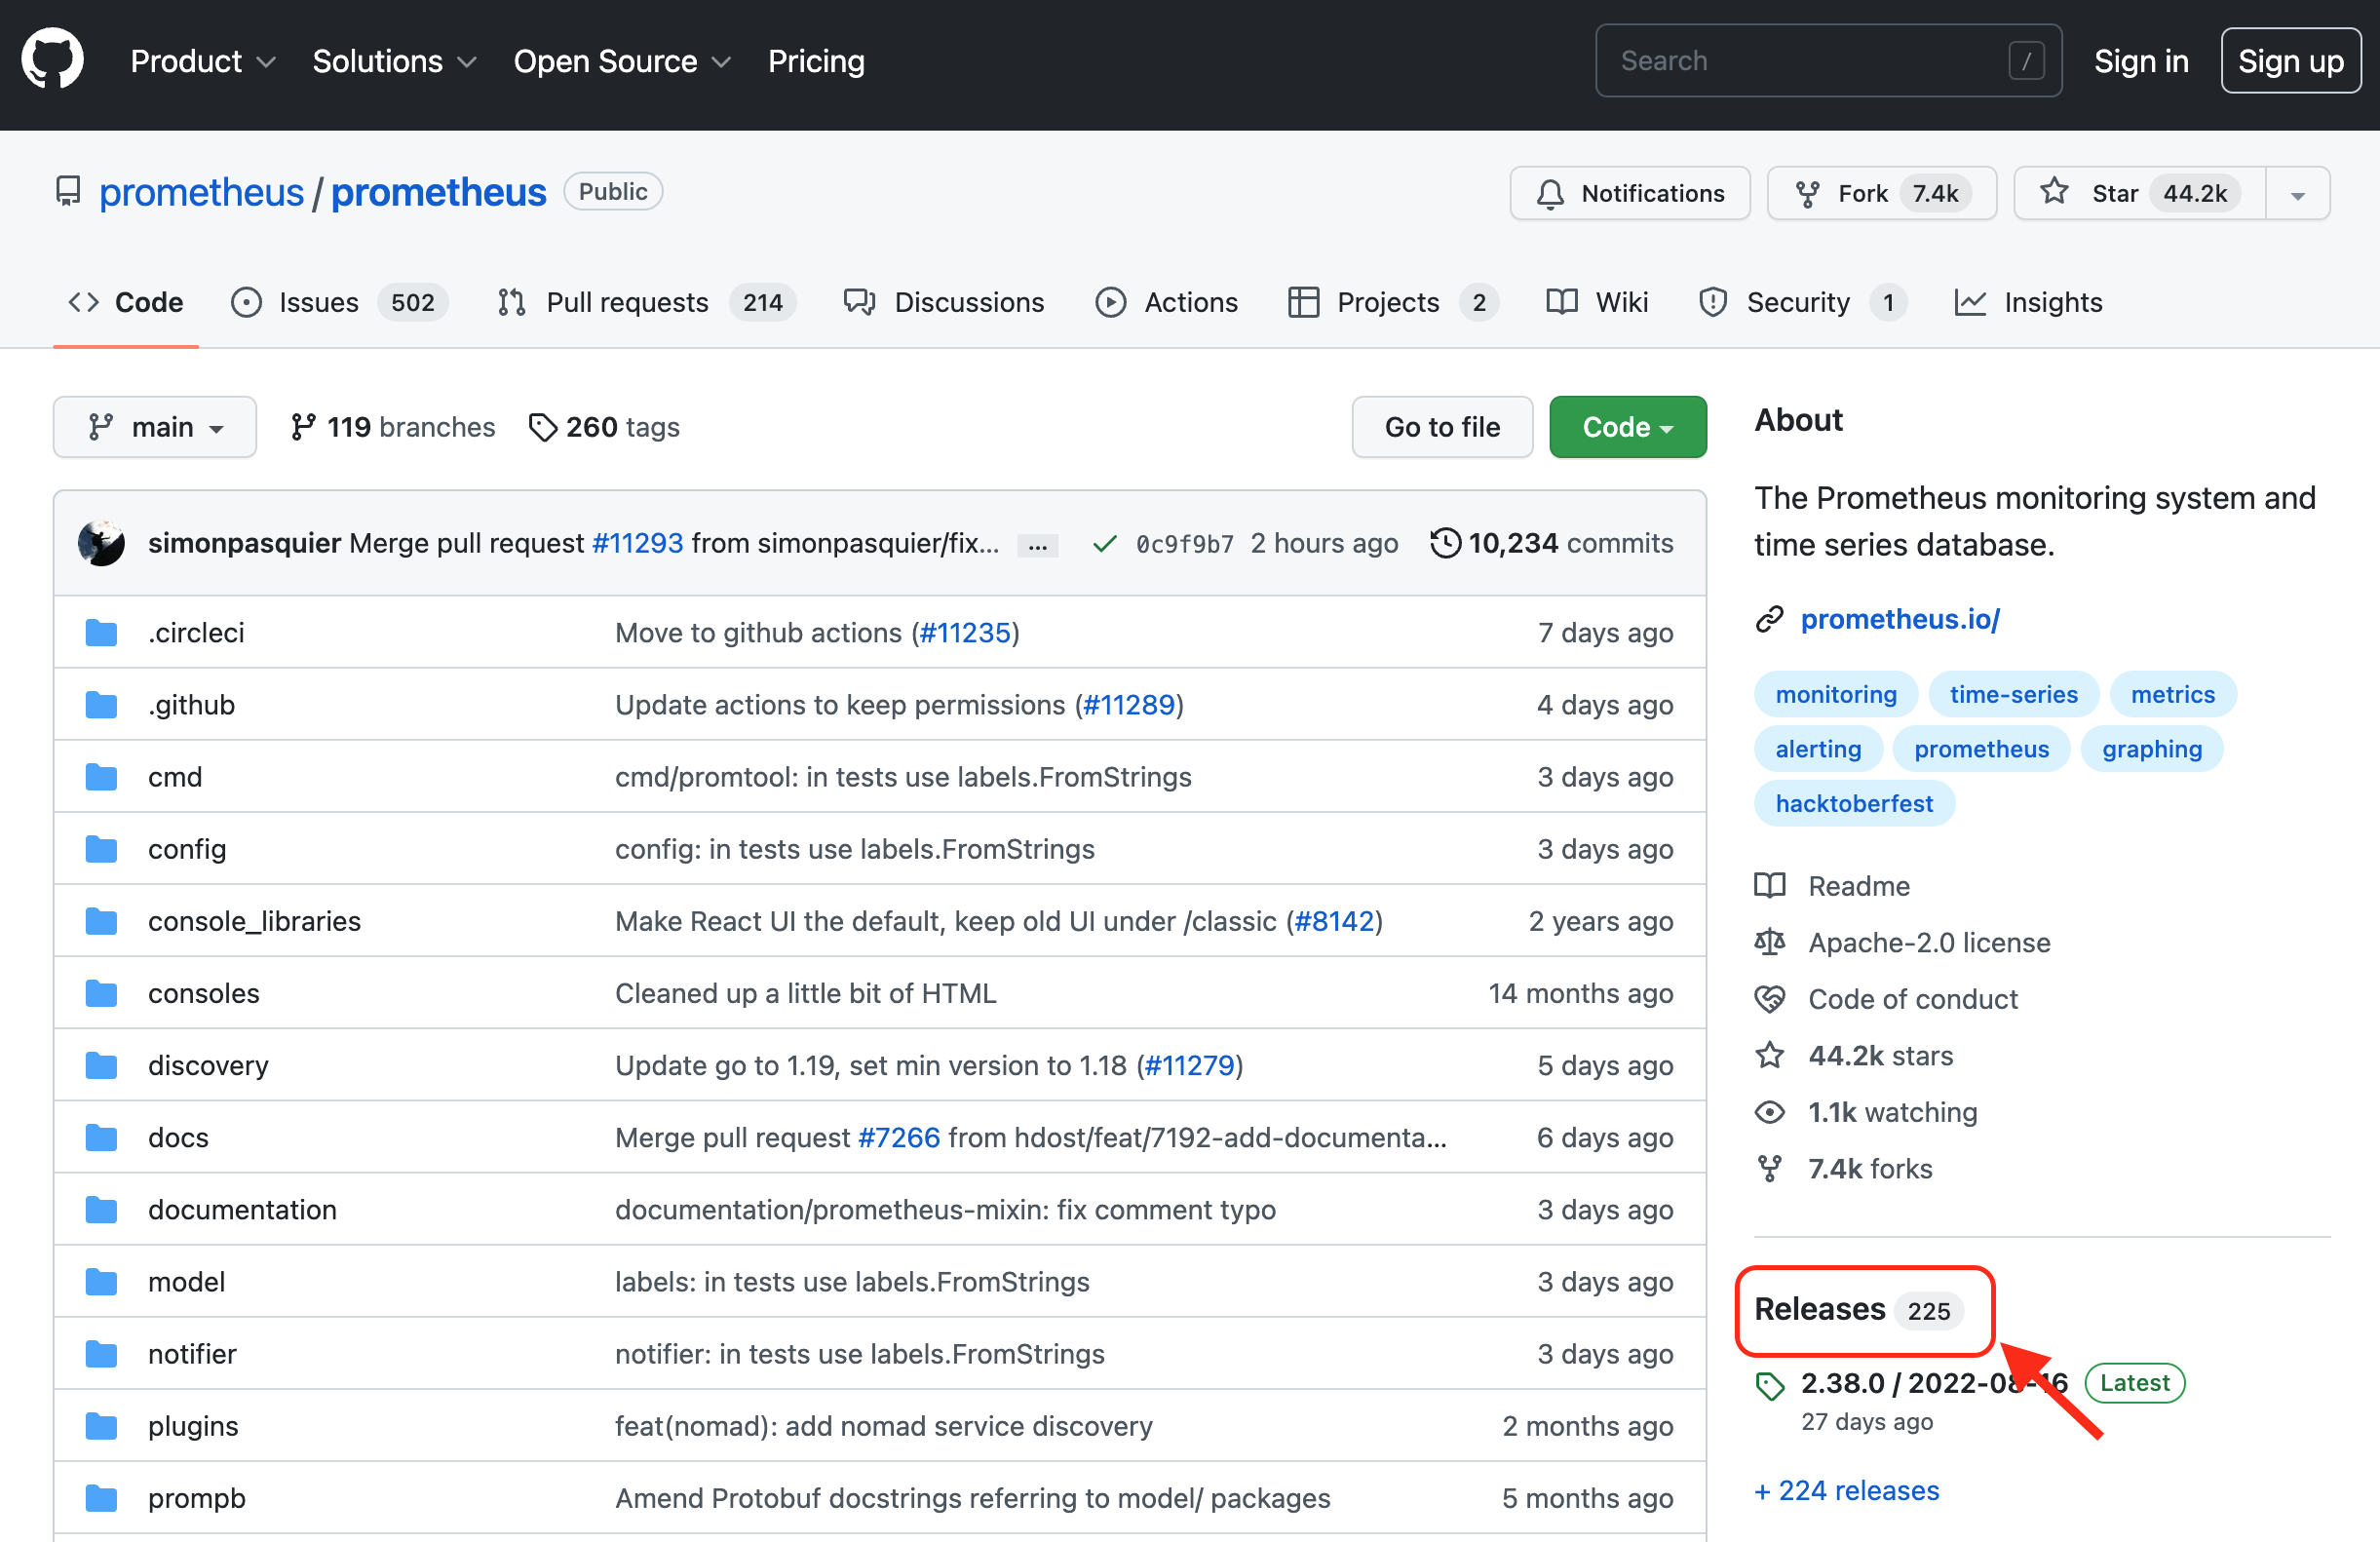
GitHub의 Prometheus 리포지토리로 이동하여 Releases를 클릭한다.
여기서 조금 주의해야 하는 것은 릴리스 되고 있는 것을 보면, Latest-release와 Pre-release가 있다. Pre-release는 β판(beta version), 이른바 초기 릴리스 같은 것이므로, 기본적으로는 Latest-release를 사용하는 좋다.
아래로 조금 내리면
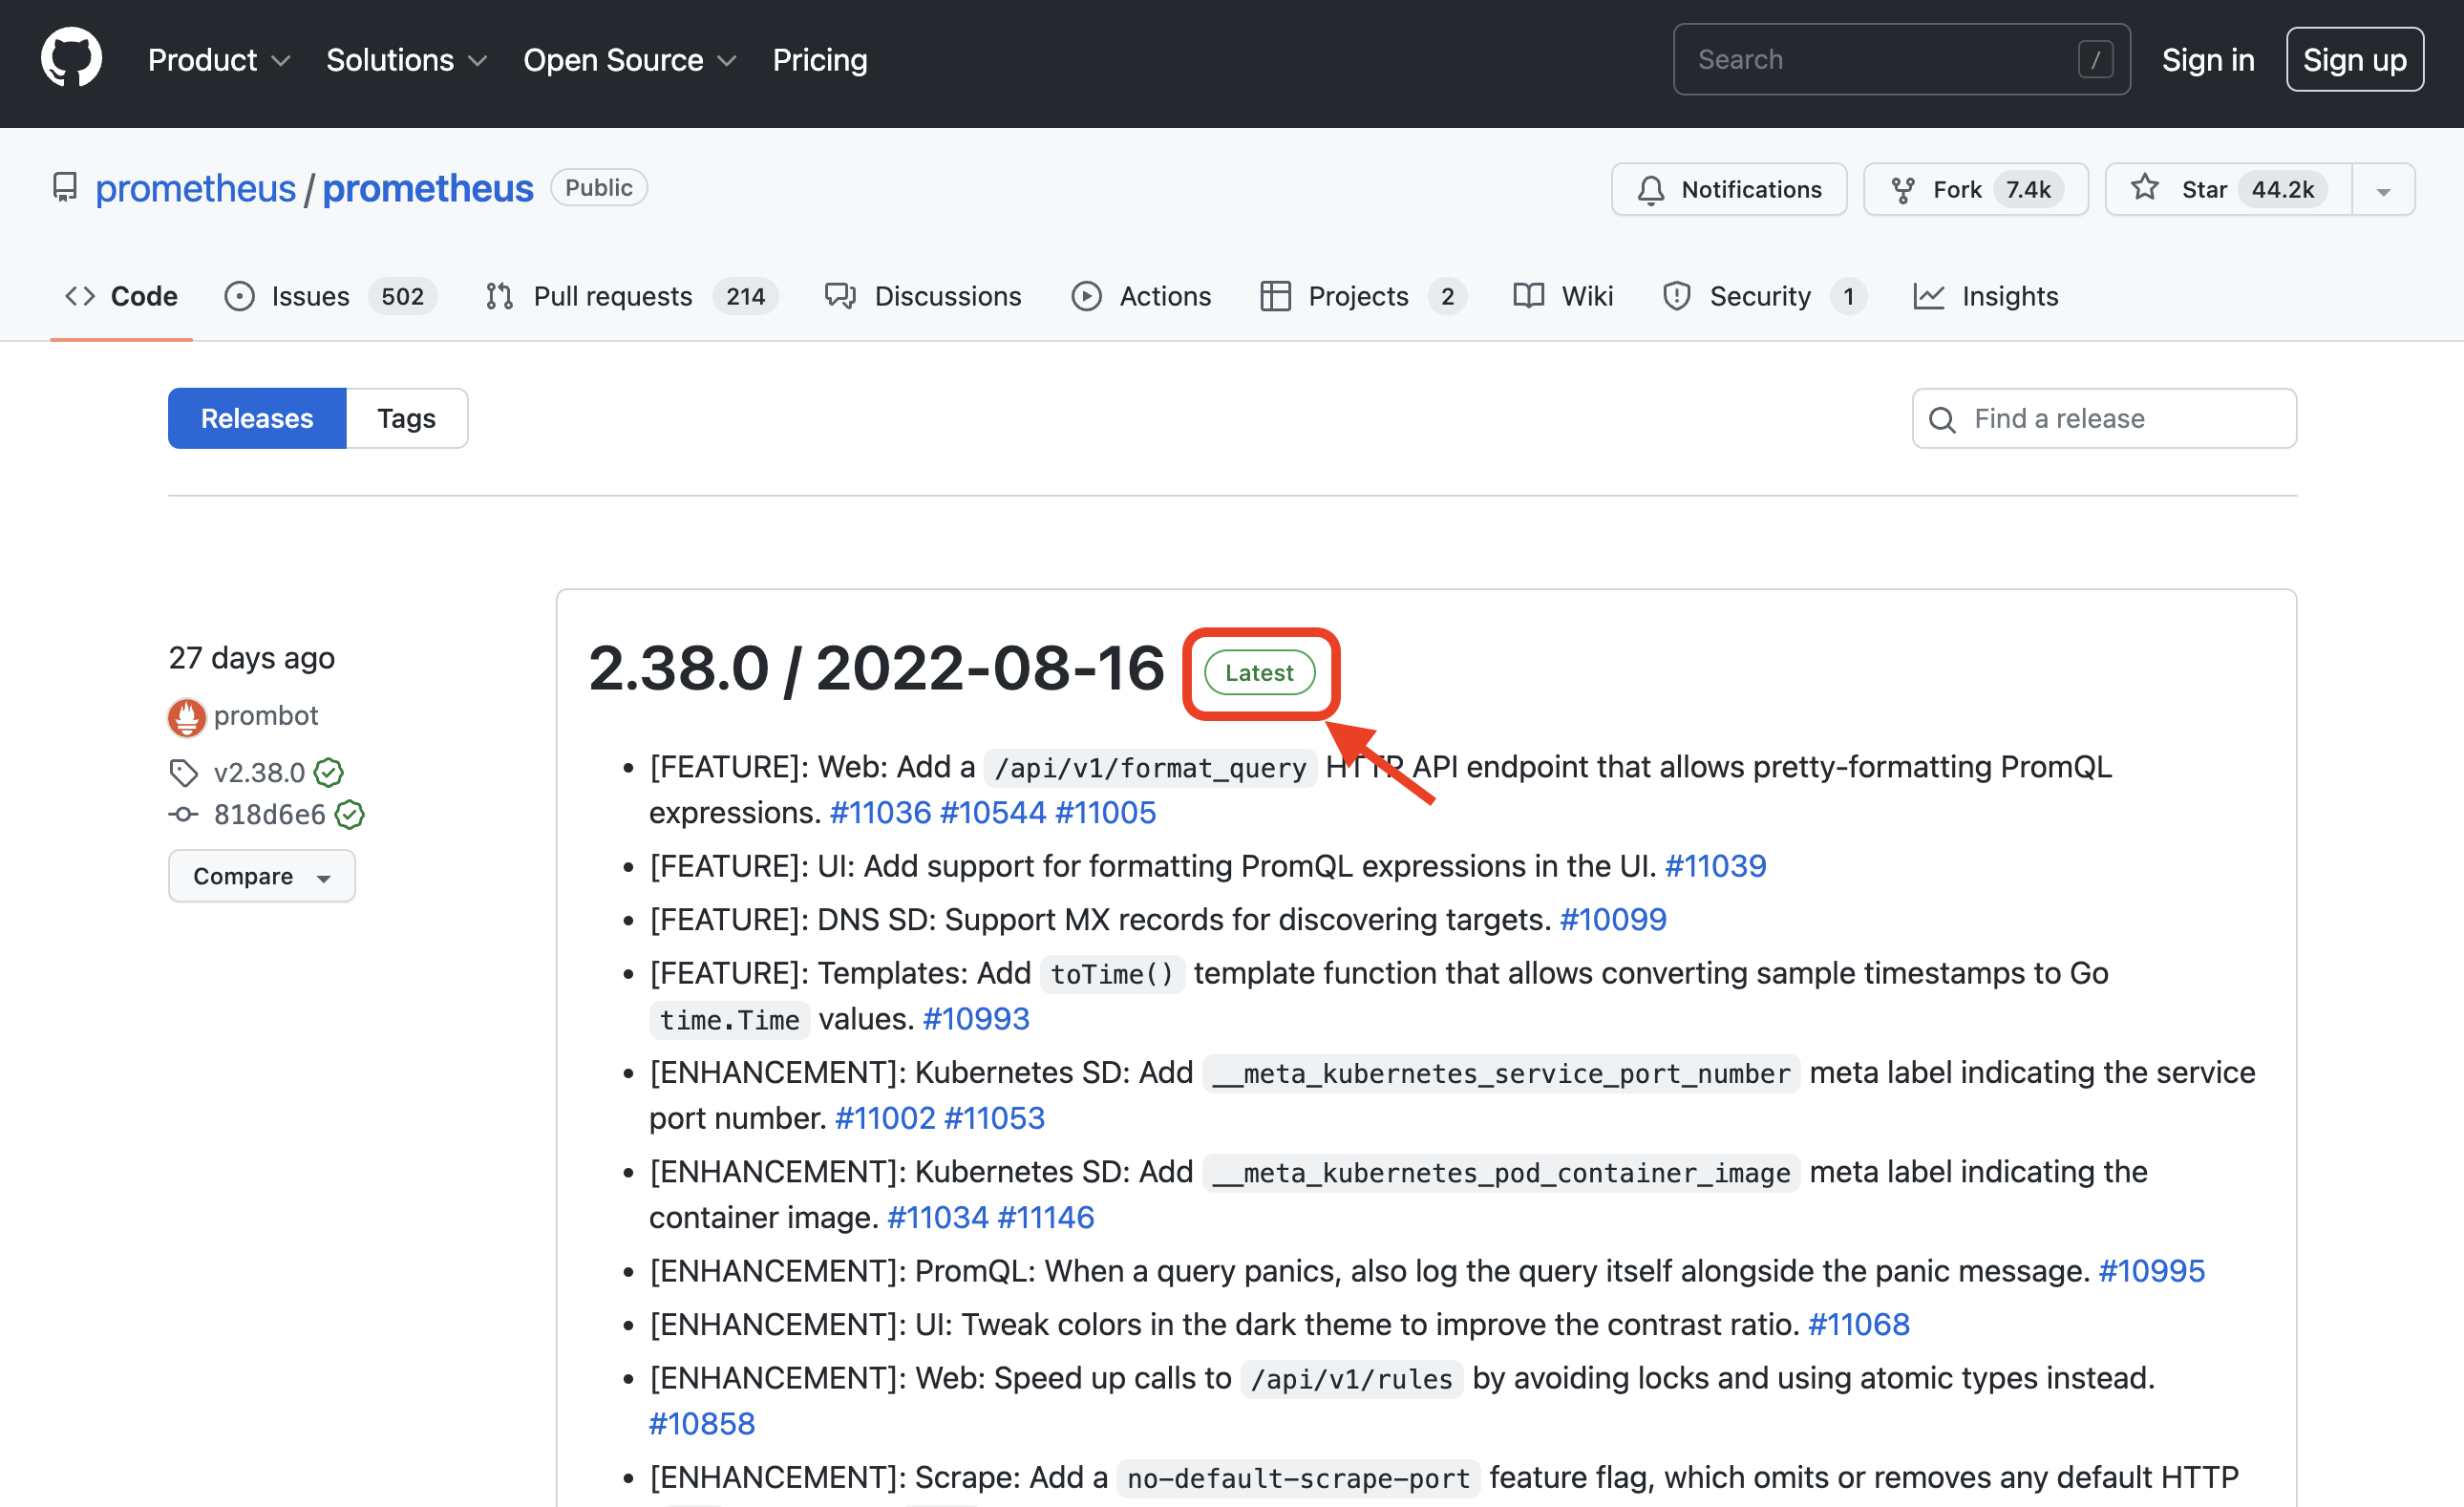
Latest로 되어 있는 버전 사용한다.
리눅스에서 Prometheus 설치
각 아키텍처마다 바이너리가 준비되어 있으므로 여기에서는 linux-amd64라는 것을 사용한다. 아카이브 URL을 복사하여 wget으로 다운로드 할 수 있다. wget은 즉시 끝나므로 다운로드 한 파일을 tar로 압축을 풉니 다. 그러면 디렉터리가 완성되므로 거기를 보면 이런 느낌으로 파일이 전개됩니다.
$ wget https://github.com/prometheus/prometheus/releases/download/v2.38.0/prometheus-2.38.0.linux-amd64.tar.gz
$ tar xfz prometheus-2.38.0.linux-amd64.tar.gz
$ cd prometheus-2.38.0.linux-amd64
$ ls -aF
./                 LICENSE            console_libraries/ prometheus*        promtool*
../                NOTICE             consoles/          prometheus.yml
위에 파일 중에 prometheus라는 것이 Prometheus 서버 본체이다. 여기서 다음 명령을 실행하면 Prometheus가 동작한다. (참고: 시스템에서 iptables와 같은 방화벽 기능을 사용하는 경우 명령을 실행하기 전에 포트 9090 통신을 허용해야 한다.)
$ ./prometheus
macOS에서 Prometheus 설치
Homebrew으로도 간단히 설치할 수 있다.
brew install prometheus
실행 결과:
% brew install prometheus
Running `brew update --auto-update`...
==> Auto-updated Homebrew!
Updated 1 tap (homebrew/core).
==> New Formulae
antidote                   commitlint                 liblbfgs                   pyyaml                     xctesthtmlreport
apophenia                  ghc@8.10                   objconv                    schemathesis               xwin

You have 3 outdated formulae installed.
You can upgrade them with brew upgrade
or list them with brew outdated.

==> Downloading https://ghcr.io/v2/homebrew/core/prometheus/manifests/2.38.0
######################################################################## 100.0%
==> Downloading https://ghcr.io/v2/homebrew/core/prometheus/blobs/sha256:cc5db7e9f7a224c46e1f426b8a12ae2155ef379b1132922766ecb0a47ef5
==> Downloading from https://pkg-containers.githubusercontent.com/ghcr1/blobs/sha256:cc5db7e9f7a224c46e1f426b8a12ae2155ef379b11329227
######################################################################## 100.0%
==> Pouring prometheus--2.38.0.arm64_monterey.bottle.tar.gz
==> Caveats
When run from `brew services`, `prometheus` is run from
`prometheus_brew_services` and uses the flags in:
   /opt/homebrew/etc/prometheus.args

To restart prometheus after an upgrade:
  brew services restart prometheus
Or, if you don't want/need a background service you can just run:
  /opt/homebrew/opt/prometheus/bin/prometheus_brew_services
==> Summary
🍺  /opt/homebrew/Cellar/prometheus/2.38.0: 22 files, 204.0MB
==> Running `brew cleanup prometheus`...
Disable this behaviour by setting HOMEBREW_NO_INSTALL_CLEANUP.
Hide these hints with HOMEBREW_NO_ENV_HINTS (see `man brew`).
설치 완료 후에 서비스를 기동한다.
brew services start prometheus
실행 결과:
% brew services start prometheus
==> Tapping homebrew/services
Cloning into '/opt/homebrew/Library/Taps/homebrew/homebrew-services'...
remote: Enumerating objects: 2094, done.
remote: Counting objects: 100% (4/4), done.
remote: Compressing objects: 100% (4/4), done.
remote: Total 2094 (delta 0), reused 0 (delta 0), pack-reused 2090
Receiving objects: 100% (2094/2094), 586.80 KiB | 11.74 MiB/s, done.
Resolving deltas: 100% (927/927), done.
Tapped 1 command (45 files, 741.4KB).
==> Successfully started `prometheus` (label: homebrew.mxcl.prometheus)
반대로 서비스를 중지 명령은 아래와 같다.
brew services stop prometheus
실행 결과:
% brew services stop prometheus
Stopping `prometheus`... (might take a while)
==> Successfully stopped `prometheus` (label: homebrew.mxcl.prometheus)
Prometheus 설치 완료 후에 확인
Prometheus를 동작시킨 후에는, 동작한 호스트의 9090번 포트에 연결한다. URL로는 아래에 액세스한다.
http://(호스트 IP 주소):9090/
혹은 로컬에 설치하였다면, localhost에 접속해도 된다.
http://localhost:9090/
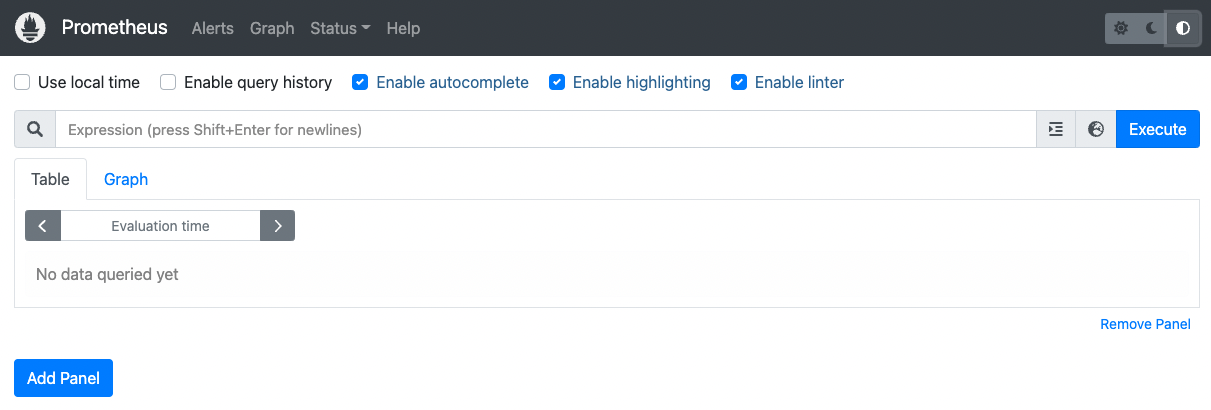
Prometheus 시작 후 화면
이것으로 최소한의 설치와 설정이 완료되었다. 매우 간단하다.
Node Exporter 사용
이대로라면 아무것도 모니터링을 하지 않고 있는 상태이므로, Node Exporter라고 하는 것을 더 사용해 보려고 한다.
앞에서 Prometheus를 사용할 때 Exporter가 여러 가지 있다는 이야기를 했었다. 그것에 대해서 더 보려고 한다. “Prometheus Exporter"라고 검색해 보면, “Exporters and Intergrations” 라는 페이지가 나오고 링크해 보면, 꽤 많은 링크가 표시된다. 이것들은 모두 Prometheus의 Exporter이다.
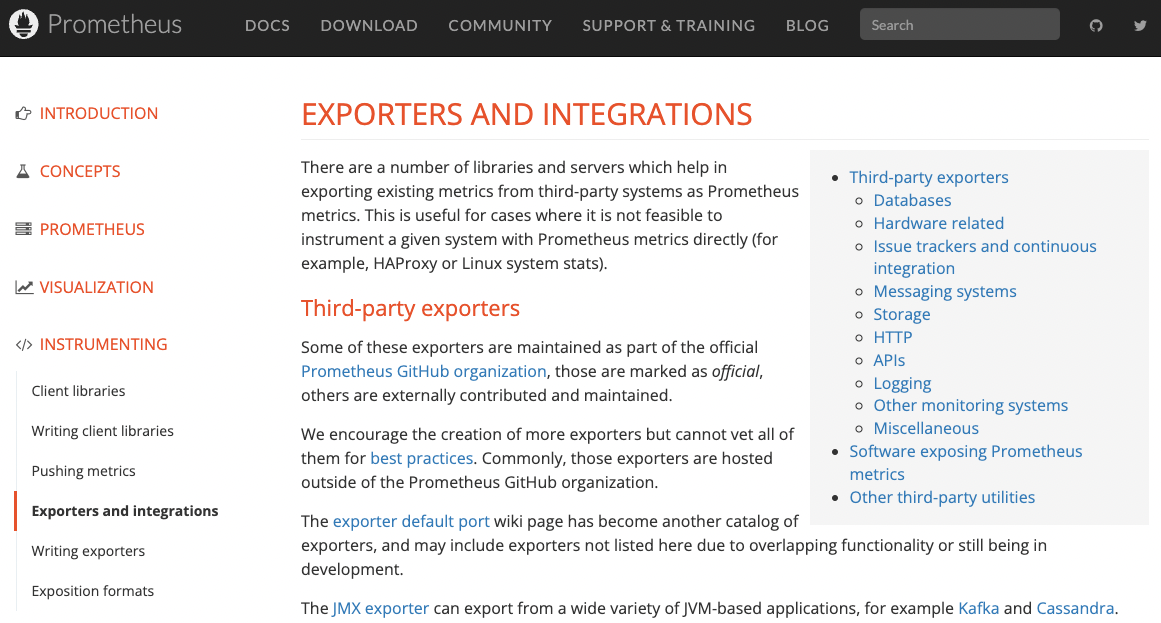
Prometheus Exporter 페이지
여기서는 이 중에서 Node Exporter를 사용한다. 목록 중에 “Node/system metrics exporter"라고 되어 있다. 이는 소위 리눅스와 같은 시스템의 메트릭 정보를 수집하기 위한 Metrics Exporter로 되어 있다.
리눅스에서 Node Exporter 설치
이것을 사용하는 경우에도 이전의 Prometheus와 동일하게 Releases 페이지로 날아가서 linux-amd64 링크를 복사하여 wget으로 다운로드한다. 그리고는 해제하면 node_exporter 디렉터리가 생성되므로, 그 디렉터리에 들어가, 커멘드를 동작시켜 주는 것만으로 된다.
$ wget https://github.com/prometheus/node_exporter/releases/download/v1.3.1/node_exporter-1.3.1.linux-amd64.tar.gz
$ tar xfz node_exporter-1.3.1.linux-amd64.tar.gz
$ cd node_exporter-1.3.1.linux-amd64
$ ./node_exporter
움직이면 로그를 보고, 아래와 같은 로그가 나오면 된다.
msg="Listening on" address=9100
macOS에서 Node Exporter 설치
brew install node_exporter
실행 결과:
% brew install node_exporter
==> Auto-updated Homebrew!
Updated 1 tap (homebrew/core).

You have 3 outdated formulae installed.
You can upgrade them with brew upgrade
or list them with brew outdated.

==> Downloading https://ghcr.io/v2/homebrew/core/node_exporter/manifests/1.3.1
######################################################################## 100.0%
==> Downloading https://ghcr.io/v2/homebrew/core/node_exporter/blobs/sha256:8e99e508cef6d2a24256e593f93b74e2963ad1cc7e5c2afd00a5b8c2a
==> Downloading from https://pkg-containers.githubusercontent.com/ghcr1/blobs/sha256:8e99e508cef6d2a24256e593f93b74e2963ad1cc7e5c2afd
######################################################################## 100.0%
==> Pouring node_exporter--1.3.1.arm64_monterey.bottle.tar.gz
==> Caveats
When run from `brew services`, `node_exporter` is run from
`node_exporter_brew_services` and uses the flags in:
  /opt/homebrew/etc/node_exporter.args

To restart node_exporter after an upgrade:
  brew services restart node_exporter
Or, if you don't want/need a background service you can just run:
  /opt/homebrew/opt/node_exporter/bin/node_exporter_brew_services
==> Summary
🍺  /opt/homebrew/Cellar/node_exporter/1.3.1: 11 files, 15.3MB
==> Running `brew cleanup node_exporter`...
Disable this behaviour by setting HOMEBREW_NO_INSTALL_CLEANUP.
Hide these hints with HOMEBREW_NO_ENV_HINTS (see `man brew`).
설치 완료 후에 서비스를 기동한다.
brew services start node_exporter
실행 결과:
% brew services start node_exporter
==> Successfully started `node_exporter` (label: homebrew.mxcl.node_exporter)
Node Exporter 설치 완료 후에 확인
그럼, Prometheus를 사용해 가는데 있어서, Exporter의 정보는 어디에 써야 하는지 알아보려고 한다.
다운로드 받아서 파일로 설치를 하였다면 설치된 폴더에서, Homebrew로 설치하였다면 /opt/homebrew/etc/에서, prometheus.yml 이 YAML 파일을 열어 보겠다. 그러면 다음과 같은 형태로 파일이 작성되어 있다
global:
  scrape_interval: 15s

scrape_configs:
  - job_name: "prometheus"
    static_configs:
    - targets: ["localhost:9090"]
이 파일의 scrape_configs 항목에는 Prometheus의 설정을, 특히 모니터 타겟의 설정을 작성되어 있다. 구체적으로는 타겟 마다 job_name과 설정을 가진다. job_name 항목에는 prometheus로 되어 있으며, static_configs에 대상을 추가한다. static_configs 에는 Prometheus의 Service Discovery와 별도로 제공되는 대상 추가 기능으로 정적으로, 대상 정보를 수집할 수 있게 된다. 이렇게 사용함으로써 기존과 같이 단순히 서버의 IP 주소라든지 FQDN을 건네주는 것만으로 간단하게 타겟의 모니터링을 할 수 있게 되는 것이다.
이번에는 이 static_configs를 사용하여 방금 다운로드한 Node Exporter를 모니터링을 해보자. Node Exporter는 9100번 포트로 리스닝하고 있으므로, 아래와 같이 작성하여 저장하면 된다.
global:
  scrape_interval: 15s

scrape_configs:
  - job_name: "prometheus"
    static_configs:
    - targets: ["localhost:9090"]
  - job_name: 'node'
    static_configs:
    - targets: ['localhost:9100']
그럼 다음에는 다음과 같이 Prometheus를 재기동해 주면 된다.
리눅스인 경우: 커멘드라인을 Ctrl+C으로 꼈다가 아래 명령어로 다시 켜면 된다.
$ ./prometheus
macOs의 Homebrew인 경우: brew 서비스를 중지(stop)했다가 다시 기동(start)한다.
% brew services stop prometheus
Stopping `prometheus`... (might take a while)
==> Successfully stopped `prometheus` (label: homebrew.mxcl.prometheus)

% brew services start prometheus
==> Successfully started `prometheus` (label: homebrew.mxcl.prometheus)
그럼 실제로 동작하는 Prometheus를 살펴 보겠다. 우선 상단 메뉴의 Status의 Targets를 클릭한다.
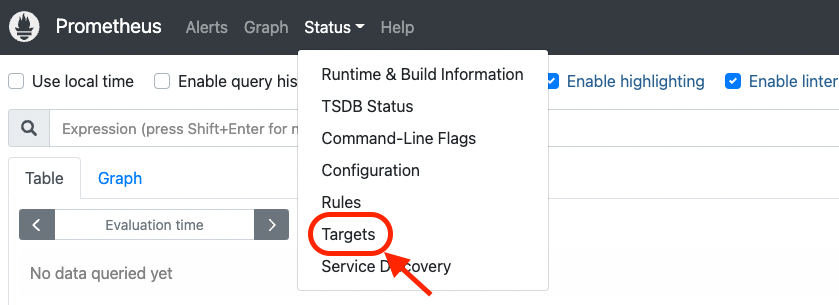
Status의 Targets을 클릭
그려면 아래와 같이 node와 prometheus가 동작하고 있는 것을 볼 수 있다.
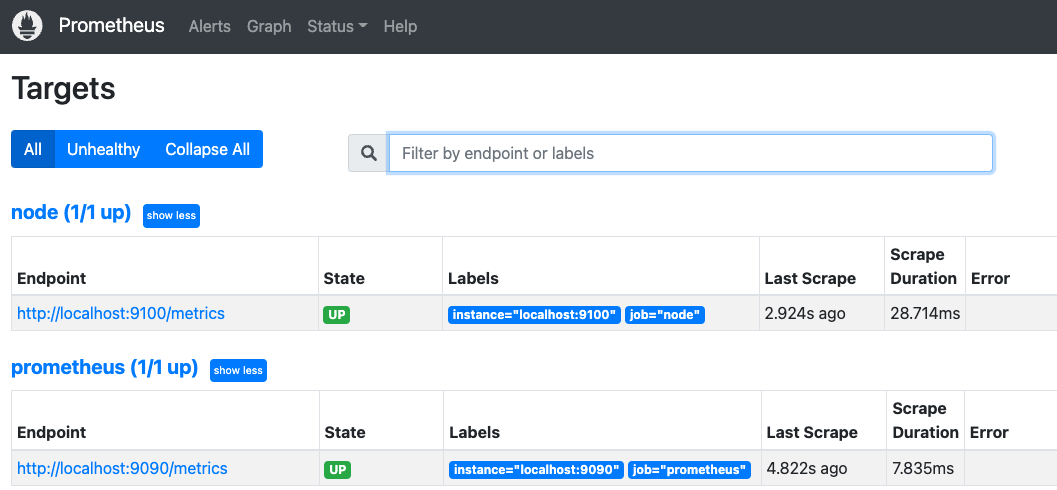
Targets 화면 표시
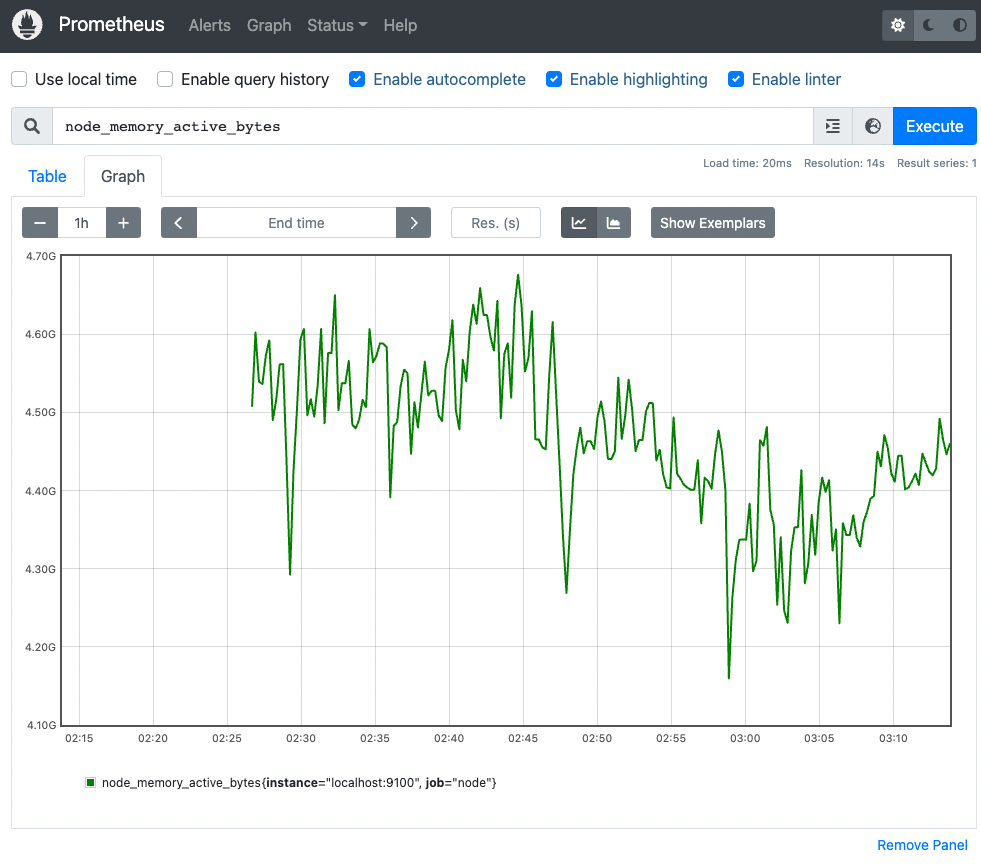
홈 화면으로 가서 이 서버의 메모리의 사용률을 보고 싶다면, 화면 상단의 입력폼에 “node"라고 이력하면, 대량의 메트릭스가 후보로서 표시된다. 그 중에서 메모리 관계에 좁히고 싶다면 폼에 “memory"를 추가로 더 입력하면 메모리에 관련된 정보가 나온다. 그 중에서 이번에는 “node_memory_active_bytes"를 선택한다.
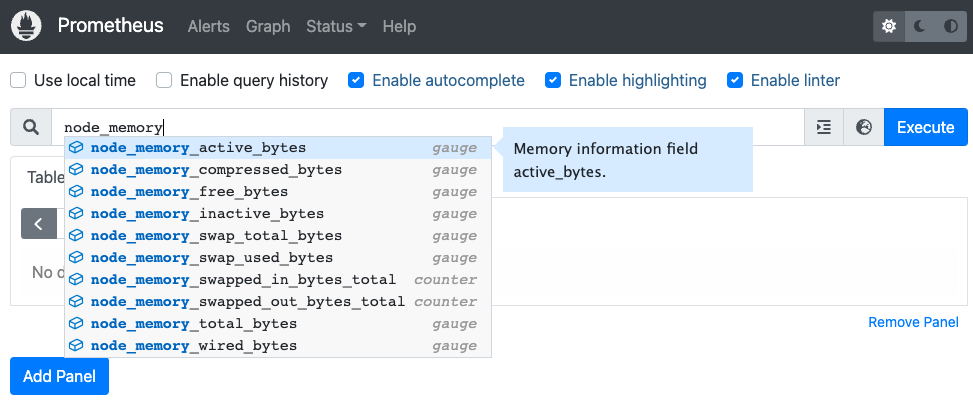
node_memory_active_bytes 선택
그러면, 아래 화면과 같이 수치가 나온다. 단위는 바이트이다.
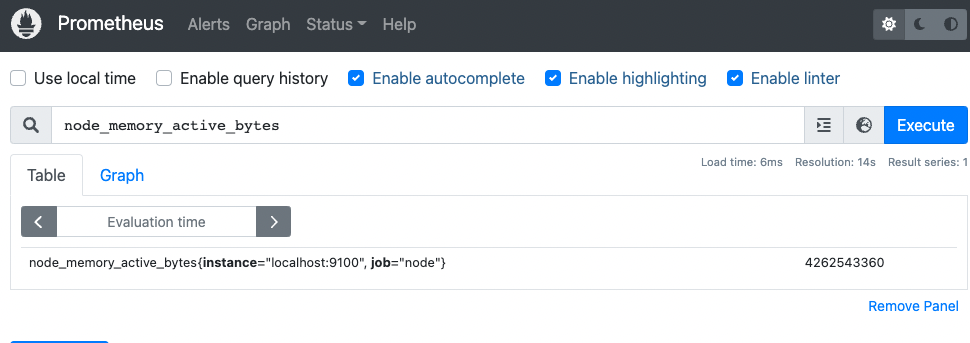
node_memory_Active_bytes를 실행한 곳
그리고, 상단의 Graph 탭을 열면 그래프도 표시된다.
또, 방금 받아온 메모리의 사용량만 이었지만, 사용률을 받아오고 싶은 경우에 비율을 다루고 싶다면, 현재의 값을 전체로 나누어 주면 되므로, 메모리 전체의 용량을 취득하면 계산할 수 있을 것 같다. 그것도 Metrics가 준비되어 있으며 “node_memory_total_bytes"라는 것이 있다. 이를 사용하여 양식에 수식을 작성하여 사용률 그래프를 볼 수도 있다.
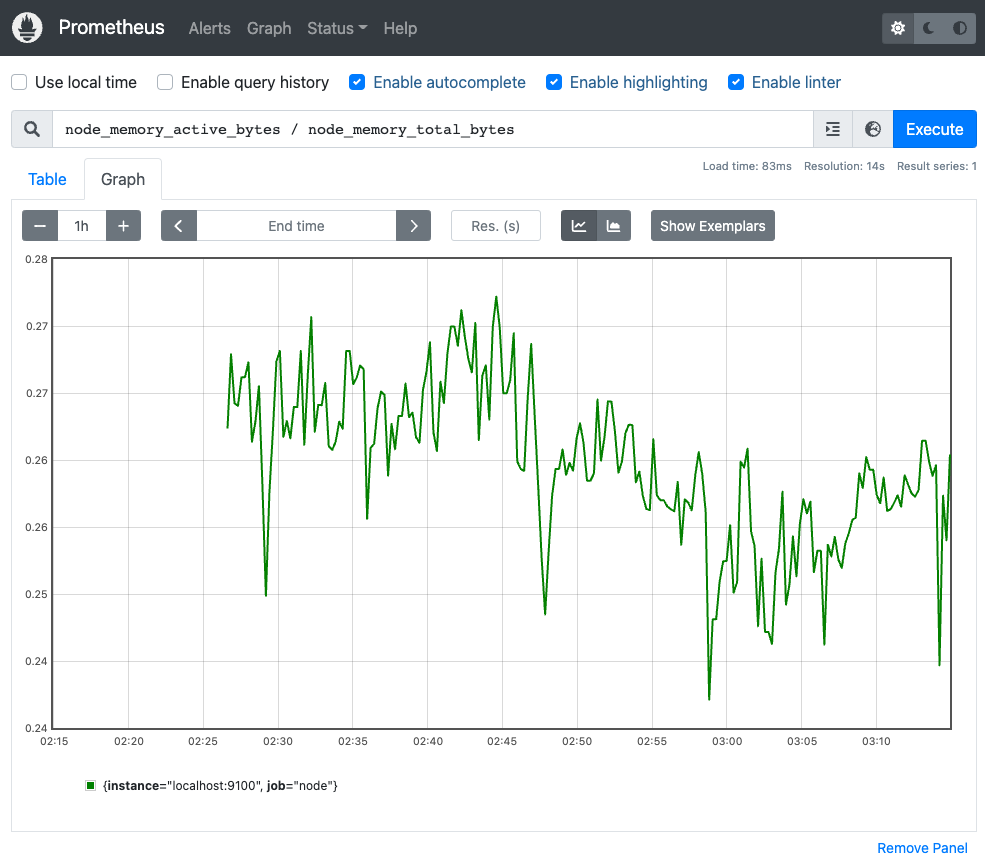
메모리 사용률의 그래프는, Y축의 값이 소수로 되어 있지만, 백분율로 표시하고 싶은 경우는 node_memory_active_bytes / node_memory_total_bytes * 100라고 입력하면 된다.
이와 같이, 매우 간단하게 Prometheus에 의한 모니터링을 실현할 수 있고, 쿼리도 실행할 수 있다.
기타 요소
데모는 이것으로 끝내고, 이 후에는 Prometheus의 다른 요소에 대해 가볍게 이야기해 보겠다.
Prometheus 스토리지
Prometheus의 스토리지는 기본적으로 로컬로 데이터를 가지고 있어 2시간마다 블록이 만들어 진다. 이 블록에는 Chunk(청크) 데이터, Index(인덱스) 데이터, Meta(메타) 데이터 등 여러 데이터가 포함되어 있으며, 이러한 데이터에 의해 실제로 수집된 Metrics가 저장되어 있다. 최근 2시간 미만의 데이터는 메모리 상에서 활용되고, 만일 크래쉬한 경우를 위해서 WAL(Write Ahead Log:로그 선행 작성)이 준비되어 있다고 하는 형태이다. 이런 구조이므로 심플하지만, 반대로 말하면 단독으로의 이중화라든지 영속화의 구조는 없다.
.
├── 01GCTTBW7XCBK1VE15SR6698EB
│   ├── chunks
│   │   └── 000001
│   ├── index
│   ├── meta.json
│   └── tombstones
├── chunks_head
│   ├── 000005
│   └── 000006
├── lock
├── queries.active
└── wal
    ├── 00000004
    ├── 00000005
    ├── 00000006
    └── checkpoint.00000003
        └── 00000000
homebrew로 설치를 하였다면, 디렉터리 위치는 /opt/homebrew/var/prometheus 여기이다.
Prometheus의 데이터 구조
그럼, 이중화의 구조가 아니라면 어떻게 해야 하는가, 외부에 그러한 구조를 갖게 할 수 있다. 이는 Remote Storage라고 하며 외부 데이터베이스에 저장하는 메커니즘이다. 해당 데이터베이스를 사용하면 해당 데이터베이스에 Metrics를 전송하거나 데이터베이스에서 Metrics를 읽을 수 있다. PostgreSQL, Graphite, InfluxDB, M3DB, Cortex, Thanos 등 다양한 데이터베이스가 지원된다. 이러한 데이터베이스 자체가 직접 Prometheus의 Remote Storage를 지원하거나 지원하지 않아도 어댑터라는 것이 존재하고 있으며, 이 어댑터를 사용하지 않고 좋은 형태로 전달하는 등의 것이 수 있다.
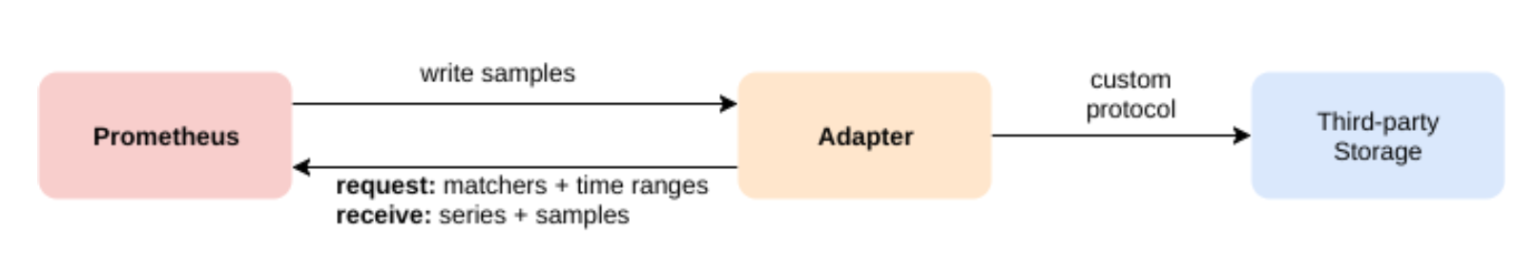
어댑터를 통한 Remote Storage 사용
실제로 Prometheus를 운영에서 사용한다고 한다면, 데이터를 로컬에 계속 유지해도 되지만, 어느 정도의 기간이라든지 대량의 데이터가 되는 경우는, 이 Remote Storage를 활용하는 것이 좋을 거라고 생각된다.
PromQL
PromQL은 Metrics를 추출하고 집계하는 언어이다. 라벨에 의한 필터링을 어떻게 하는지를 가볍게 소개한다면, 아래 그림과 같게 된다.
메트릭명만 사용:
prometheus_http_requests_total
라벨으로 필터링:
prometheus_http_requests_total{job="apiserver", handler="/api/v1/rules"}
정규표현식 필터링:
prometheus_http_requests_total{job=~".*server"}
함수 이용:
rate(prometheus_http_requests_total[5m])
맨 위 예제는 단순히 메트릭 이름만 사용하는 경우이다. 앞에서의 데모에서도 node_memory_total_bytes라든지 node_memory_active_bytes라고 하는 것을 사용했는데, 이는 Metrics 그 자체를 단순히 가져온 것이다.
이번에는 서버가 하나뿐이었기 때문에 하나의 Metrics를 다뤘지만, 이는 여러 대나 여러 컴퍼넌트가 존재하는 경우는 각각으로 필터링할 필요가 있다. 그렇다면 위에서 두 번째로 작성된 레이블로 필터링을 사용하여 얻을 수 있다. 라벨은 메트릭 이름 뒤에 {...}로 묶어 지정하면 된다. 이 예에서는 job이 apiserver가 되어 있지만, 앞에서의 node라든지 prometheus라고 하는 job이 있었다. 여기에 node를 job에 넣으면 Node Exporter가 취득한 Metrics만 추출할 수 있고, prometheus라고 지정하면 Prometheus의 Metrics만이 추출되거나 하는 것이 간단하게 할 수 있는 것이다.
이 외에도 정규 표현식으로 필터링할 수 있거나, 추출한 지표를 함수를 사용하여 가공하는 것도 가능하다.
요약
Prometheus는 클라우드 네이티브 시스템 모니터링 소프트웨어 중 하나이다. 매우 간단하고 쉽게 사용할 수 있는 점이 큰 특징이다.
그리고 이번에는 소개할 수 없었지만 강력한 Service Discovery의 기능이 있으므로, 예를 들어 Kubernetes를 사용하거나 클라우드 플랫폼을 사용하는 경우에는 특히 꼭 사용해 보는 것을 추천한다.
또한, AlertManager나 Grafana와 연계함으로써 Prometheus 단독으로는 할 수 없는 기능을 이용할 수 있다. 반대로 말하면, 고도의 시각화나 Alerting은 불필요하고, 단순히 데이터를 수집해 주고 가볍게 검색할 수 있으면 좋다고 하는 것이라면 Prometheus 단체로 충분하다. Alerting만은 원한다면 AlertManager를 사용하면 좋고 Alerting은 필요 없기 때문에 시각화만 하고 싶다면 Grafana를 조합하면 된다. 그런 형태로 조합하여 연계할 수 있다.
마지막으로, Prometheus를 사용하는데 있어서 기억했으면 하는 것은 이 Prometheus는 Observability의 실현을 향한 1개의 툴이기 때문에, 꼭 그러한 시점에서 사용해 주었으면 한다.