Spring Boot + Prometheus + Grafana + Dockerでアプリケーション監視を連携するクイックガイド

概要
Spring BootのActuatorを利用してMetricsの測定情報をPrometheusへ渡し、それをGrafanaで可視化する構成を作成する。
Spring Bootプロジェクトの作成
まず、Prometheusへ渡すメトリクスを公開するSpring Bootプロジェクトを作成する。
新規プロジェクト作成コマンド
次のようにcurlコマンドを使用してSpring Bootの新規プロジェクトを作成する。
curl https://start.spring.io/starter.tgz \
-d bootVersion=2.7.6 \
-d dependencies=web,actuator,prometheus \
-d baseDir=spring-actuator-prometheus \
-d groupId=com.devkuma \
-d artifactId=spring-actuator-prometheus \
-d packageName=com.devkuma.prometheus \
-d applicationName=ActuatorPrometheusApplication \
-d javaVersion=11 \
-d packaging=jar \
-d type=gradle-project | tar -xzvf -
このコマンドではJava 11、Spring Boot 2.7.6を使用し、依存関係としてweb、actuator、prometheusを追加している。
ビルドファイルの依存関係を確認
build.gradle
dependencies {
	implementation 'org.springframework.boot:spring-boot-starter-actuator'
	implementation 'org.springframework.boot:spring-boot-starter-web'
	runtimeOnly 'io.micrometer:micrometer-registry-prometheus'
	testImplementation 'org.springframework.boot:spring-boot-starter-test'
}
spring-boot-starter-actuatorはSpring Bootアプリケーションの情報を扱えるようにする。- Spring Boot 2.0以降のActuatorには、アプリケーションのメトリクスを測定できるMicrometerの機能が含まれている。
micrometer-registry-prometheusはPrometheusが読み取れるメトリクスを提供する役割を持つ。- このライブラリは、Micrometerが生成するメトリクスをPrometheusサーバーで利用できるメトリクス形式へ変換する。
Actuator Endpointの設定
Spring WebでActuatorを使うと、Micrometerを通じて生成されたアプリケーションのメトリクス情報をPrometheusサーバーが取得(Pull)できるように、追加のendpointを提供できる。
Actuatorでは、application.ymlのオプション(management.endpoints.web.exposure.include)で/actuatorページに公開するendpointの一覧を設定できる。
/src/main/resources/application.yml
management:
  endpoints:
    web:
      exposure:
        include: health, prometheus
ここではデフォルトで含まれるhealthとPrometheus endpointを追加している。
アプリケーションが提供するendpoint一覧を確認
アプリケーションを起動し、http://localhost:8080/actuatorへアクセスすると、Actuatorが提供するendpoint一覧を確認できる。
{
    "_links": {
        "self": {
            "href": "http://localhost:8080/actuator",
            "templated": false
        },
        "health-path": {
            "href": "http://localhost:8080/actuator/health/{*path}",
            "templated": true
        },
        "health": {
            "href": "http://localhost:8080/actuator/health",
            "templated": false
        },
        "prometheus": {
            "href": "http://localhost:8080/actuator/prometheus",
            "templated": false
        }
    }
}
ここでhttp://localhost:8080/actuator/prometheusでは、Micrometerを通じて収集されたメトリクスを確認できる。
# HELP tomcat_sessions_active_current_sessions
# TYPE tomcat_sessions_active_current_sessions gauge
tomcat_sessions_active_current_sessions 0.0
# HELP jvm_gc_pause_seconds Time spent in GC pause
# TYPE jvm_gc_pause_seconds summary
jvm_gc_pause_seconds_count{action="end of minor GC",cause="Metadata GC Threshold",} 1.0
jvm_gc_pause_seconds_sum{action="end of minor GC",cause="Metadata GC Threshold",} 0.006
# HELP jvm_gc_pause_seconds_max Time spent in GC pause
# TYPE jvm_gc_pause_seconds_max gauge
jvm_gc_pause_seconds_max{action="end of minor GC",cause="Metadata GC Threshold",} 0.006

... 以下省略 ...
ここでは、それぞれがPrometheusで認識できるメトリクス(tomcat_sessions_active_current_sessions、jvm_gc_pause_seconds_countなど)として表示されており、各メトリクスの上にHELPとTYPEも確認できる。
Prometheusサーバー
これでアプリケーション側の準備はできたので、アプリケーションが生成するメトリクスを収集するPrometheus Serverを用意する。
ここではDockerにインストールしたPrometheusを利用する。PrometheusのDockerインストールについてはこちらを参照してほしい。
Prometheusサーバーの設定
Prometheusサーバー起動時の設定ファイル(prometheus.yml)を次のように設定する。
/etc/prometheus/prometheus.yml
global:
  scrape_interval: 10s # 10秒ごとにMetricをPulling
  evaluation_interval: 10s # ruleをどれくらいの頻度で検証するかを設定
scrape_configs:
  - job_name: 'spring-actuator-prometheus'
    metrics_path: '/actuator/prometheus' # Application prometheus endpoint
    static_configs:
      - targets: ['host.docker.internal:8080'] # Application host:port
Prometheusサーバーの確認
ではPrometheusのDockerを起動し、Prometheusへアクセスしてみよう。
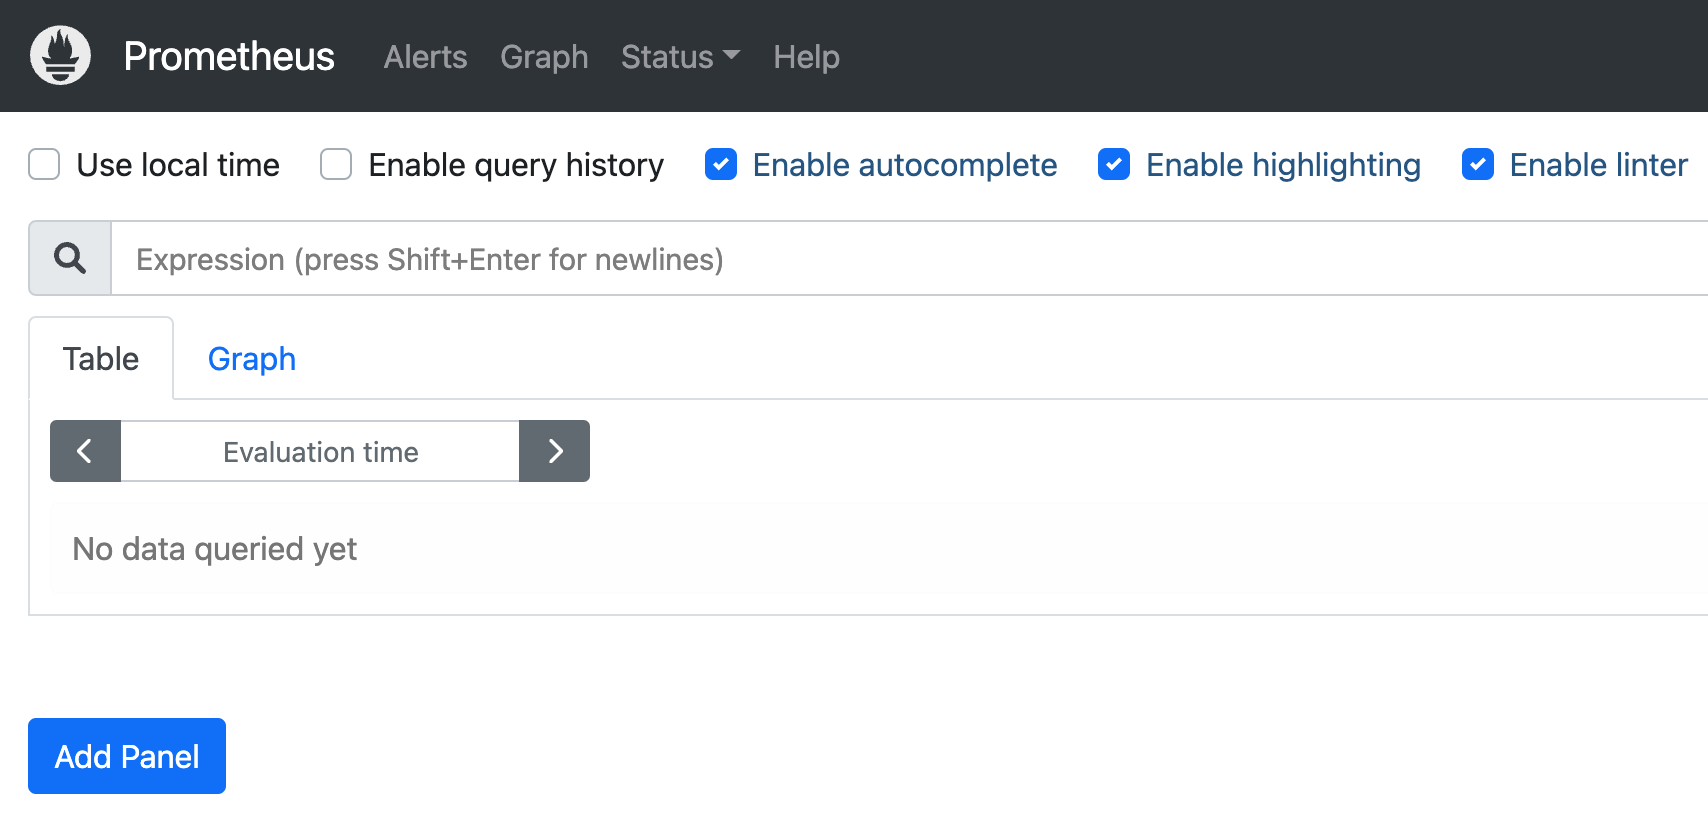
上記に問題がなければ、Prometheus(http://localhost:9090)にアクセスすると、次のようにPrometheusのメイン画面を確認できる。
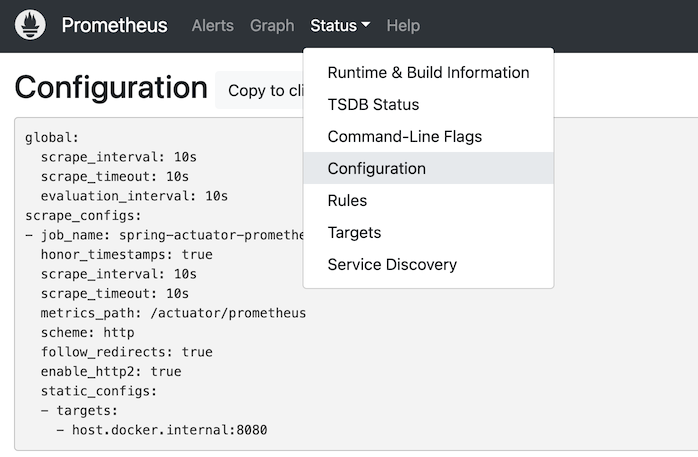
Status > Configurationメニューでは、Prometheusに設定したファイルが適用されているか確認できる。
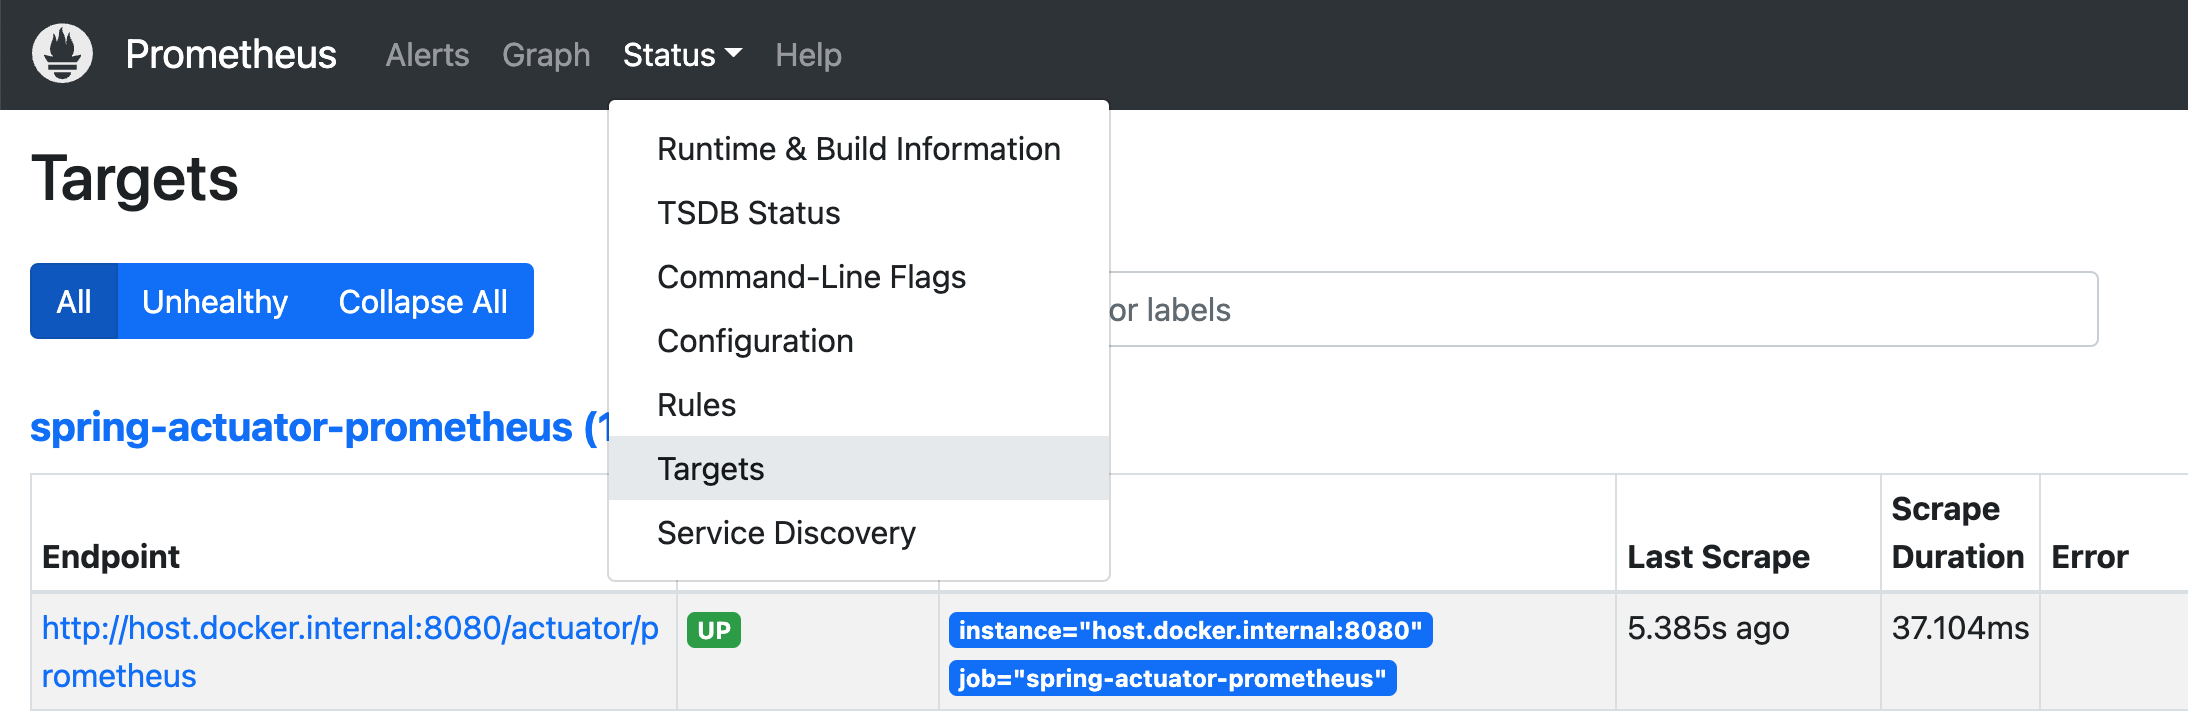
Status > Targetsメニューでは、接続されたApplicationの状態を確認できる。
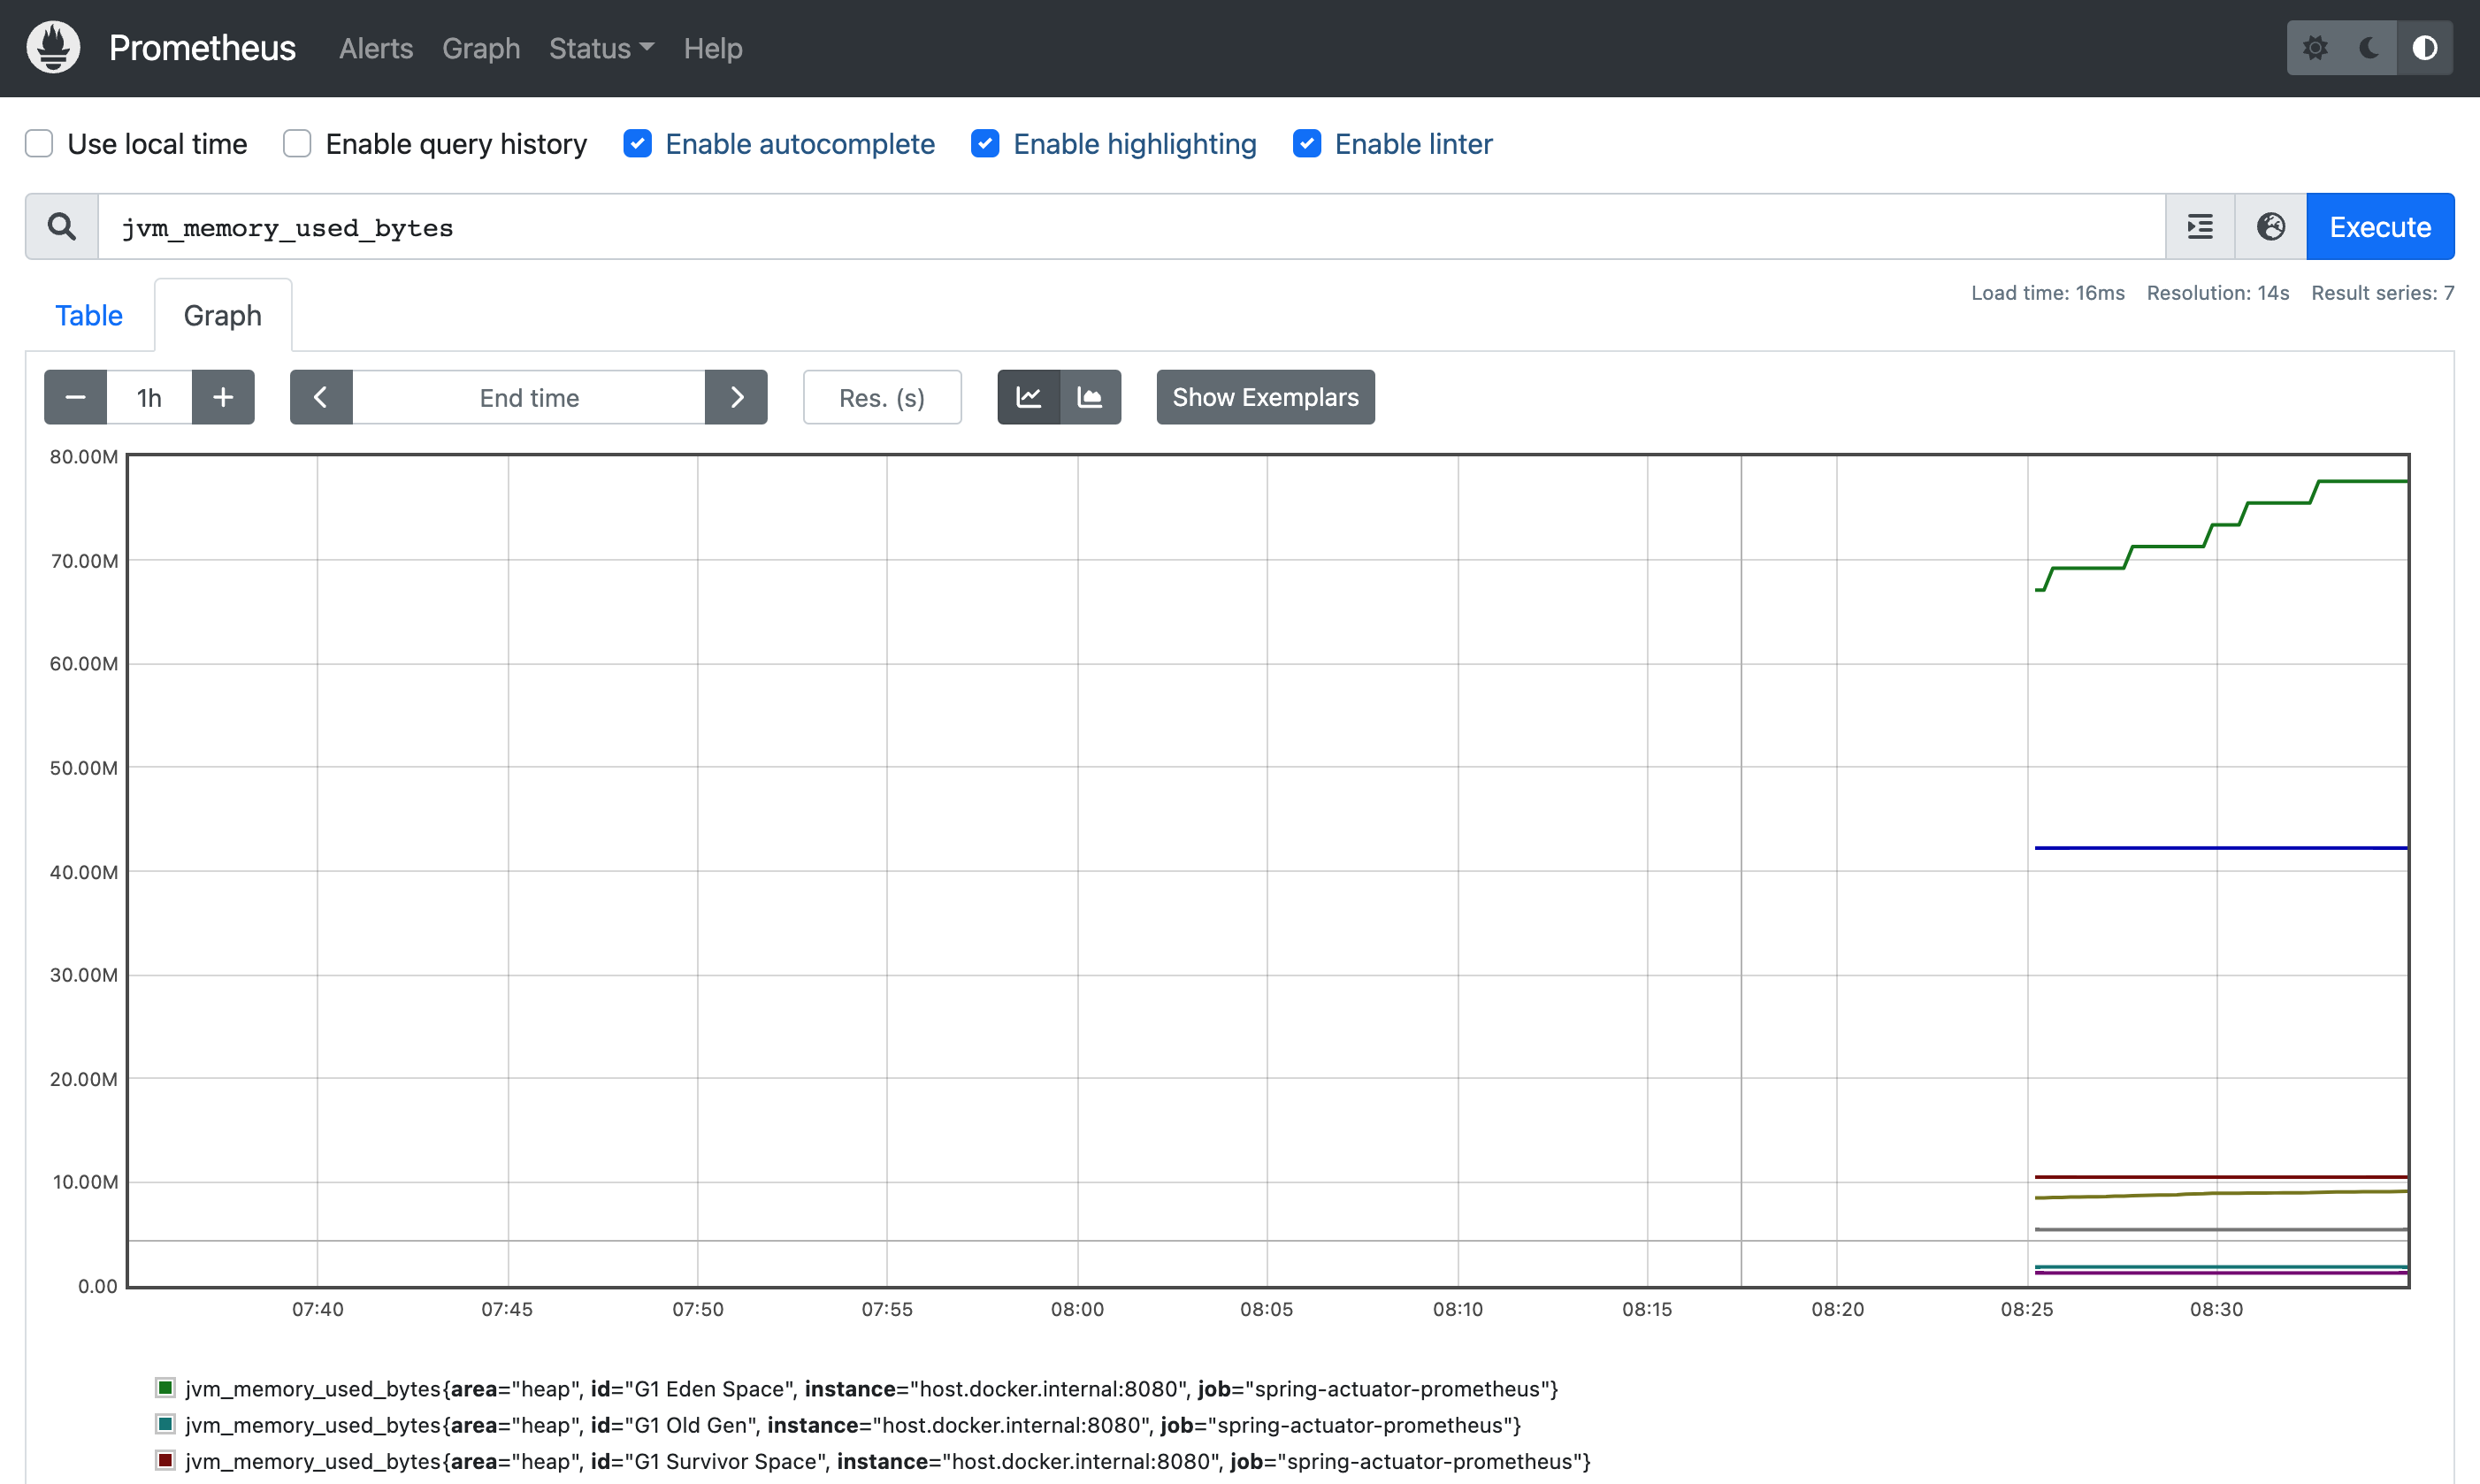
最後にメイン画面に戻り、Expressionにjvm_memory_used_bytesを入力して実行し、Graphを選択すると次のようなグラフチャートを確認できる。
Grafanaサーバー
次に、Prometheusで収集したメトリクスをGrafanaで可視化する方法を見ていく。
PrometheusのWebページでクエリを実行すれば、任意のメトリクスをグラフとして可視化できる。しかし、監視のたびに手動でクエリを実行するのは非効率であり、標準で提供されるダッシュボードも簡単なグラフを確認できる程度である。
Prometheusだけでは可視化に限界があるため、通常は別の可視化ツールを利用してメトリクスを監視する。
こちらを参考にしていれば、GrafanaもPrometheusと一緒にインストールされているはずである。
Grafanaログイン
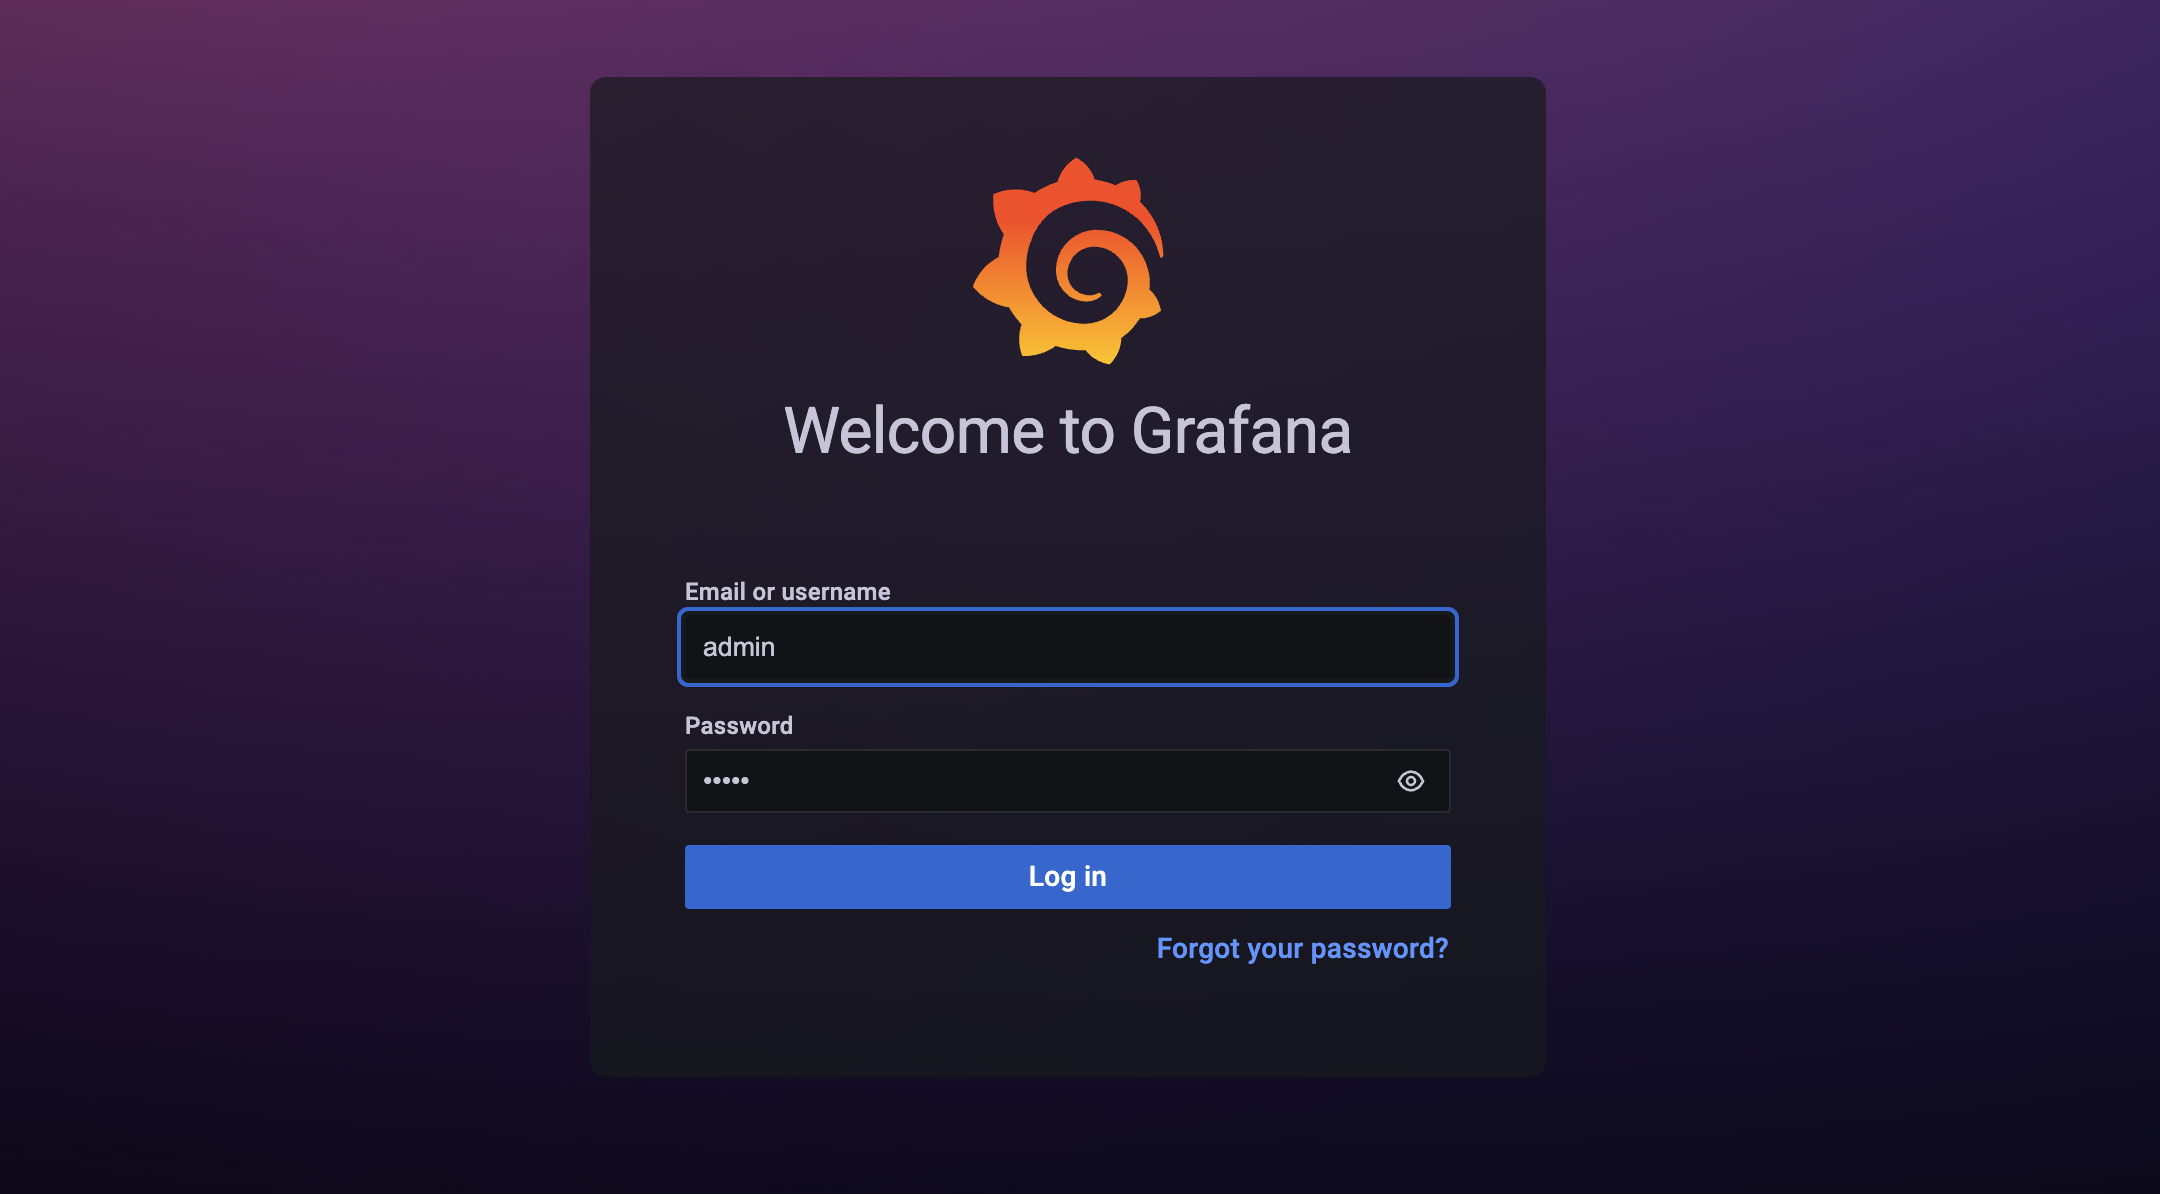
まずGrafana(http://localhost:9090)へアクセスすると、次のようにGrafanaのログイン画面を確認できる。
デフォルトで設定されているアカウント情報(ID/PW)であるadmin/adminでログインできる。
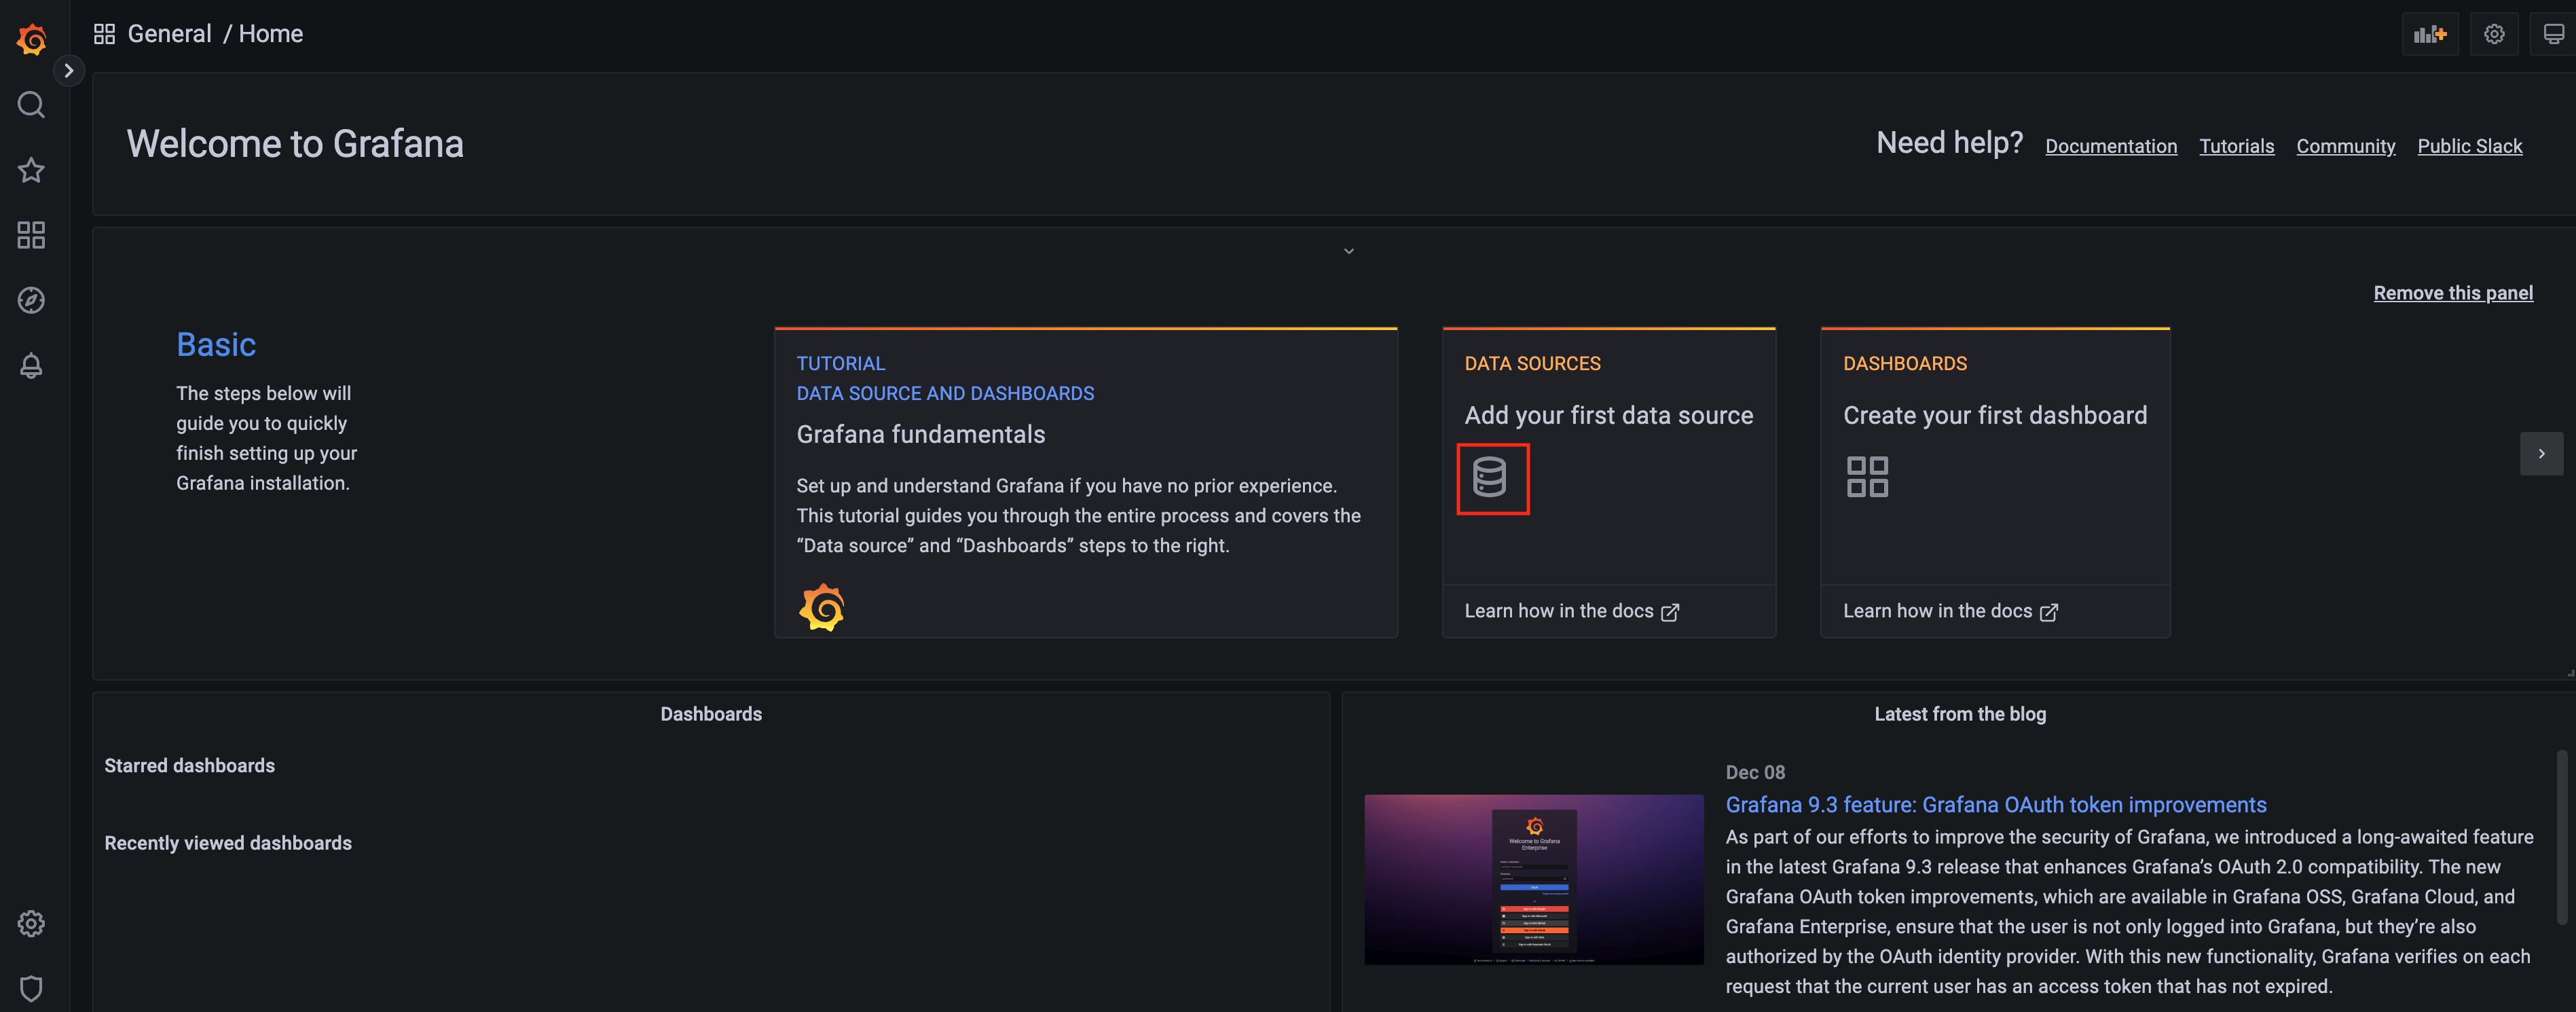
Grafanaデータソースの追加
ログインすると次のような初期画面が表示されるので、DATA SOURCESのアイコンをクリックする。
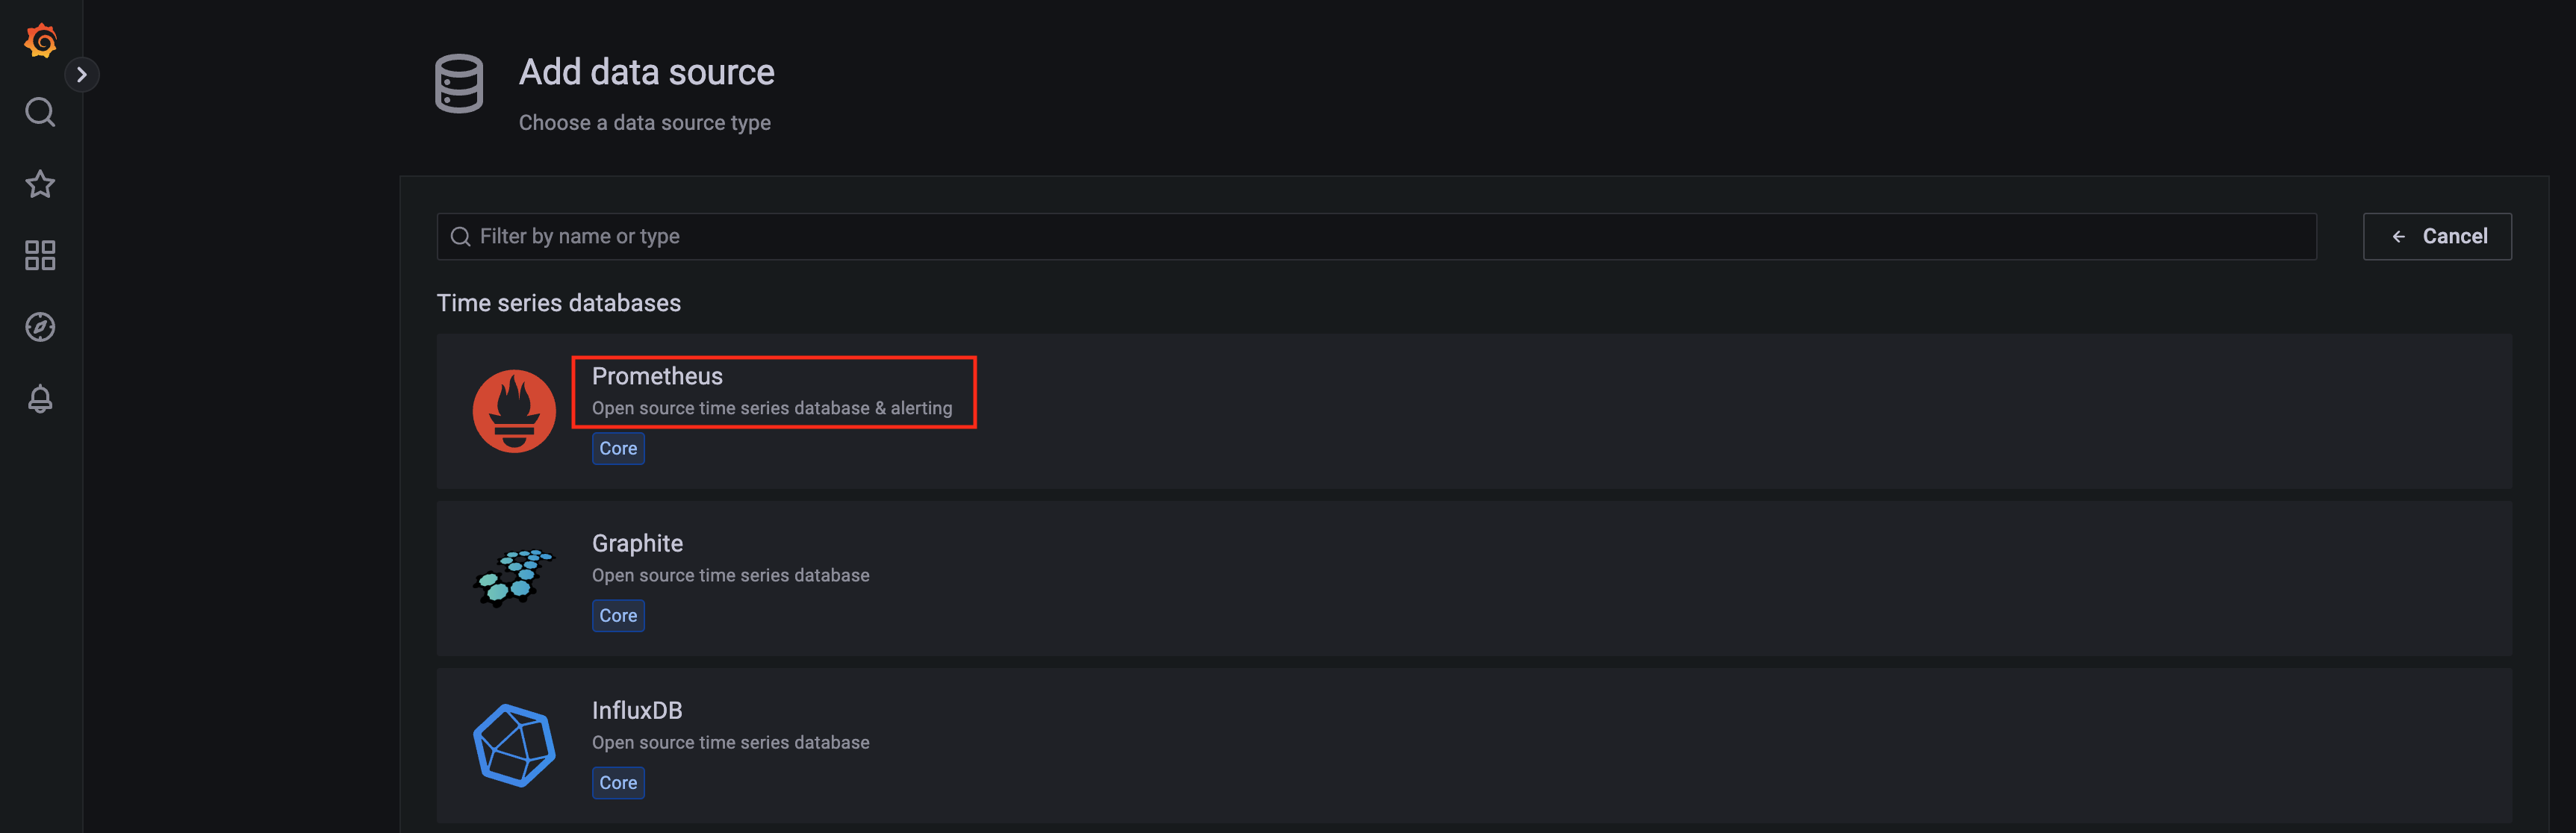
追加するData SourceからPrometheusをクリックする。
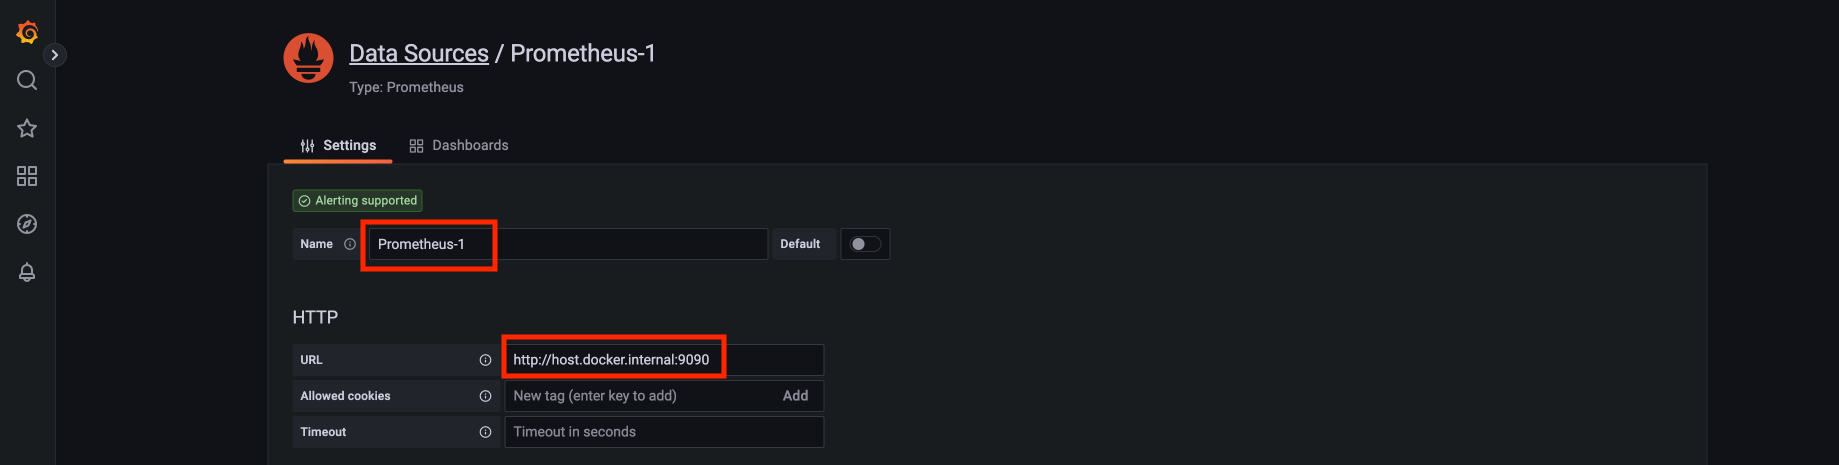
PrometheusのData Source追加画面が表示されたら、NameとURLを入力する。
Nameには任意の名前を入力し、URLにはhttp://host.docker.internal:9090を入力すればよい。
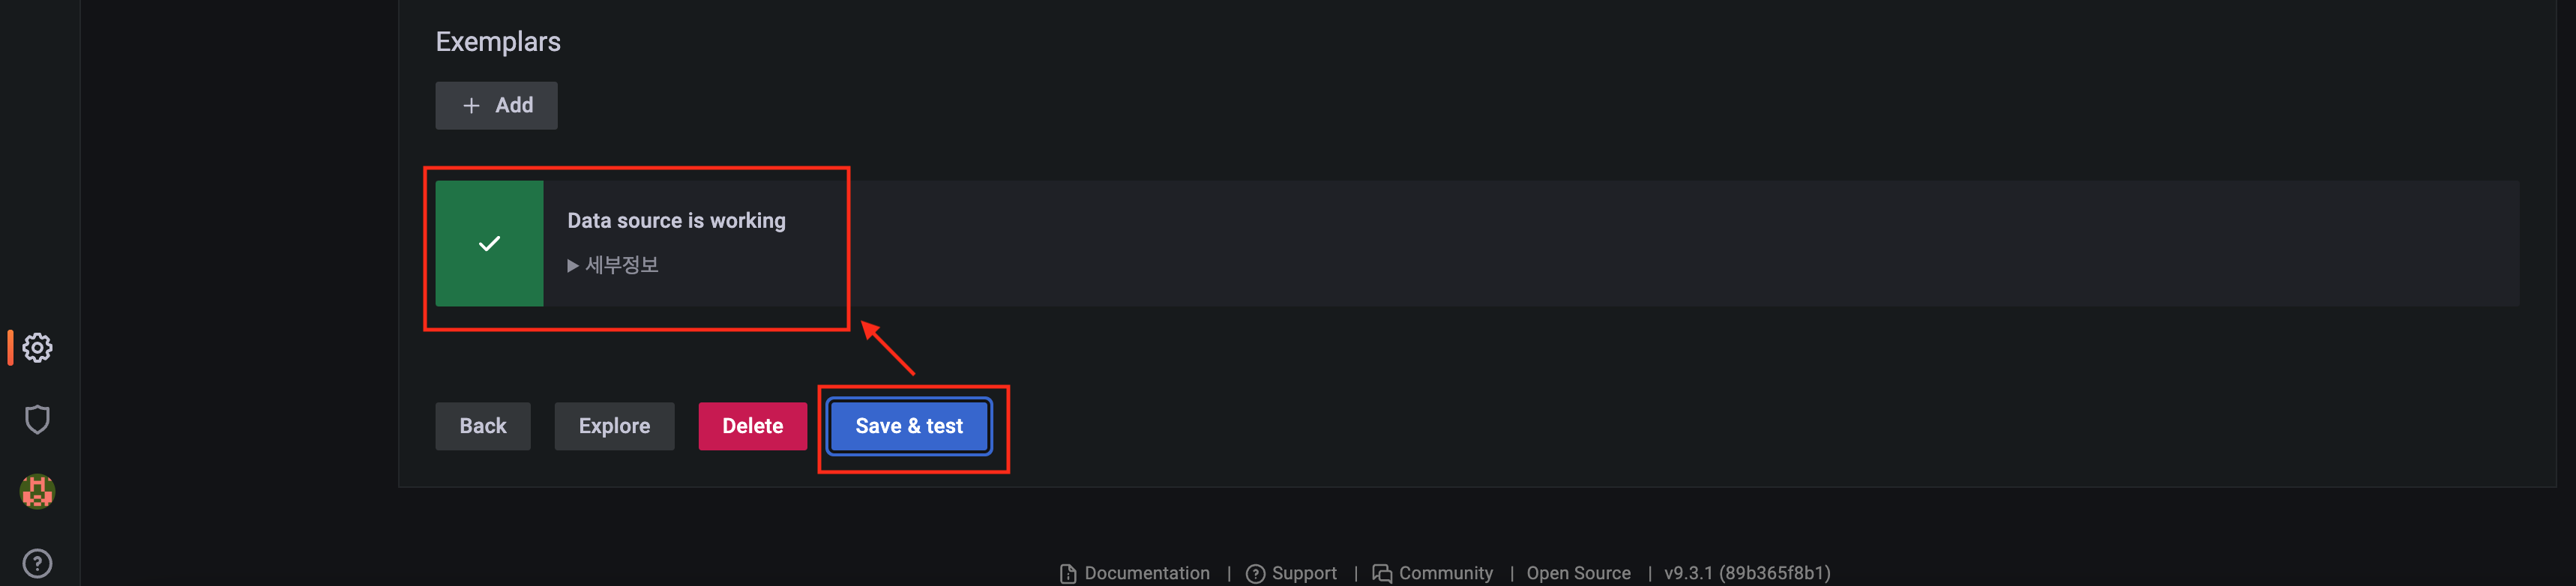
下へスクロールしてSave & testボタンをクリックすると、成功メッセージ(Data source is working)が表示される。
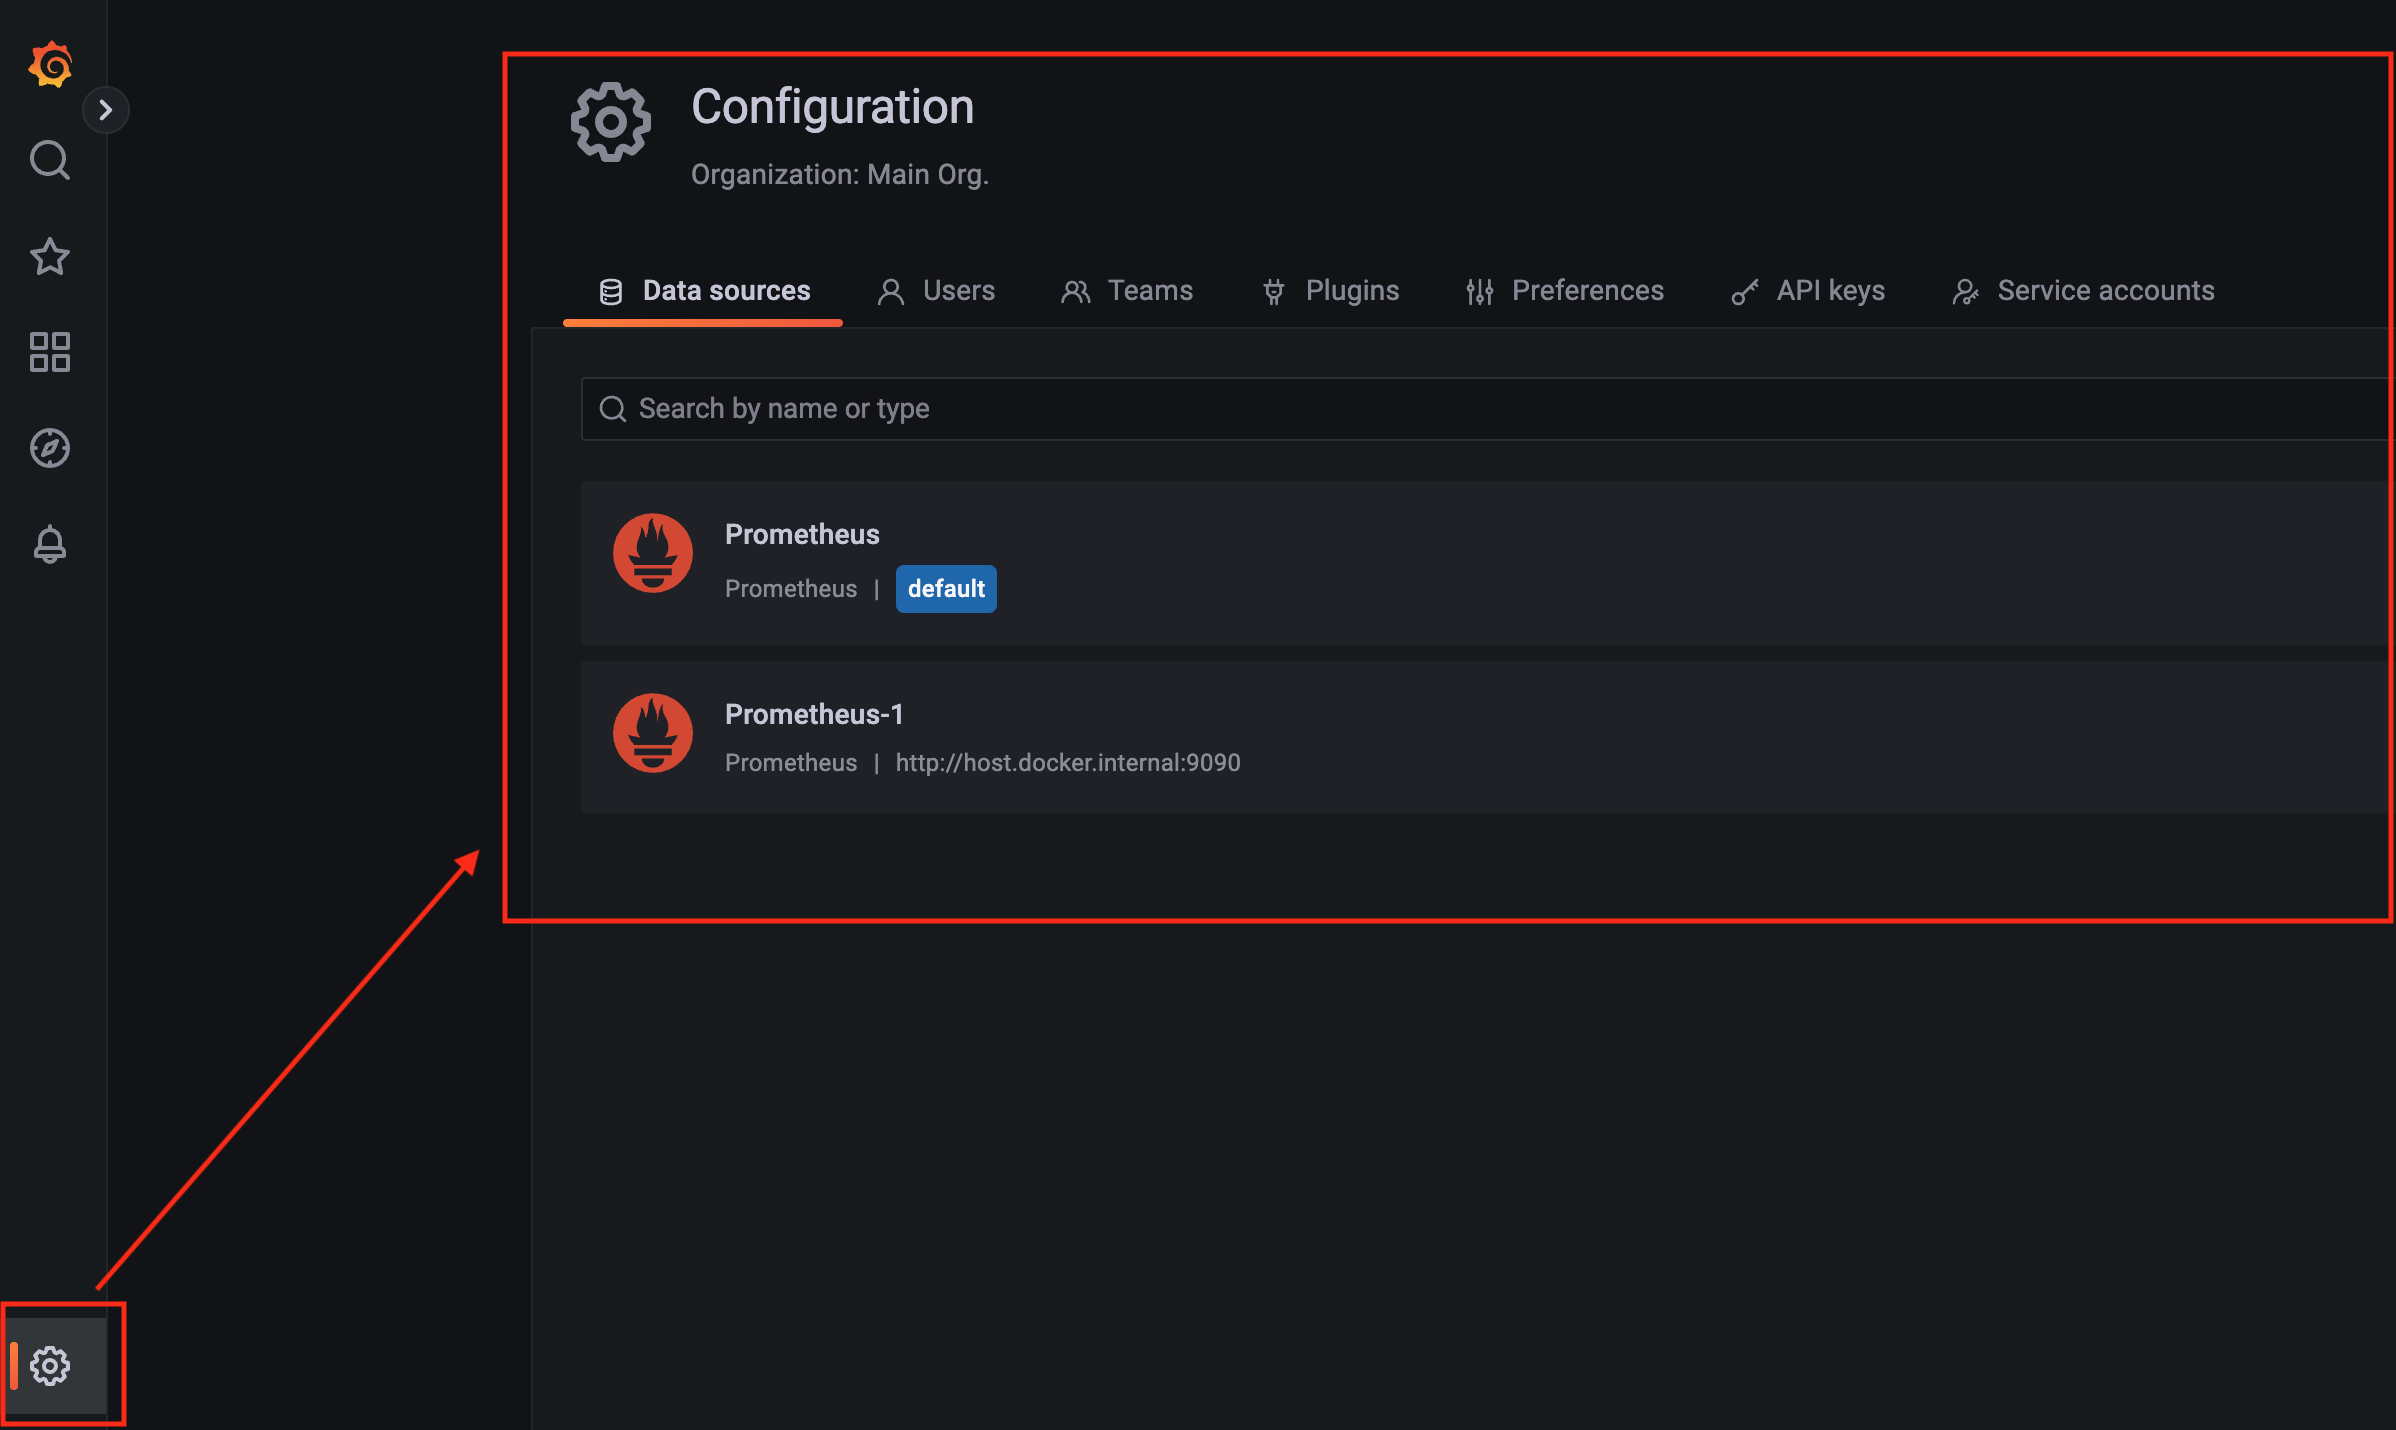
Configurationアイコンを押すと、先ほど登録したData sourceを確認できる。
Grafana Metricグラフチャートの追加
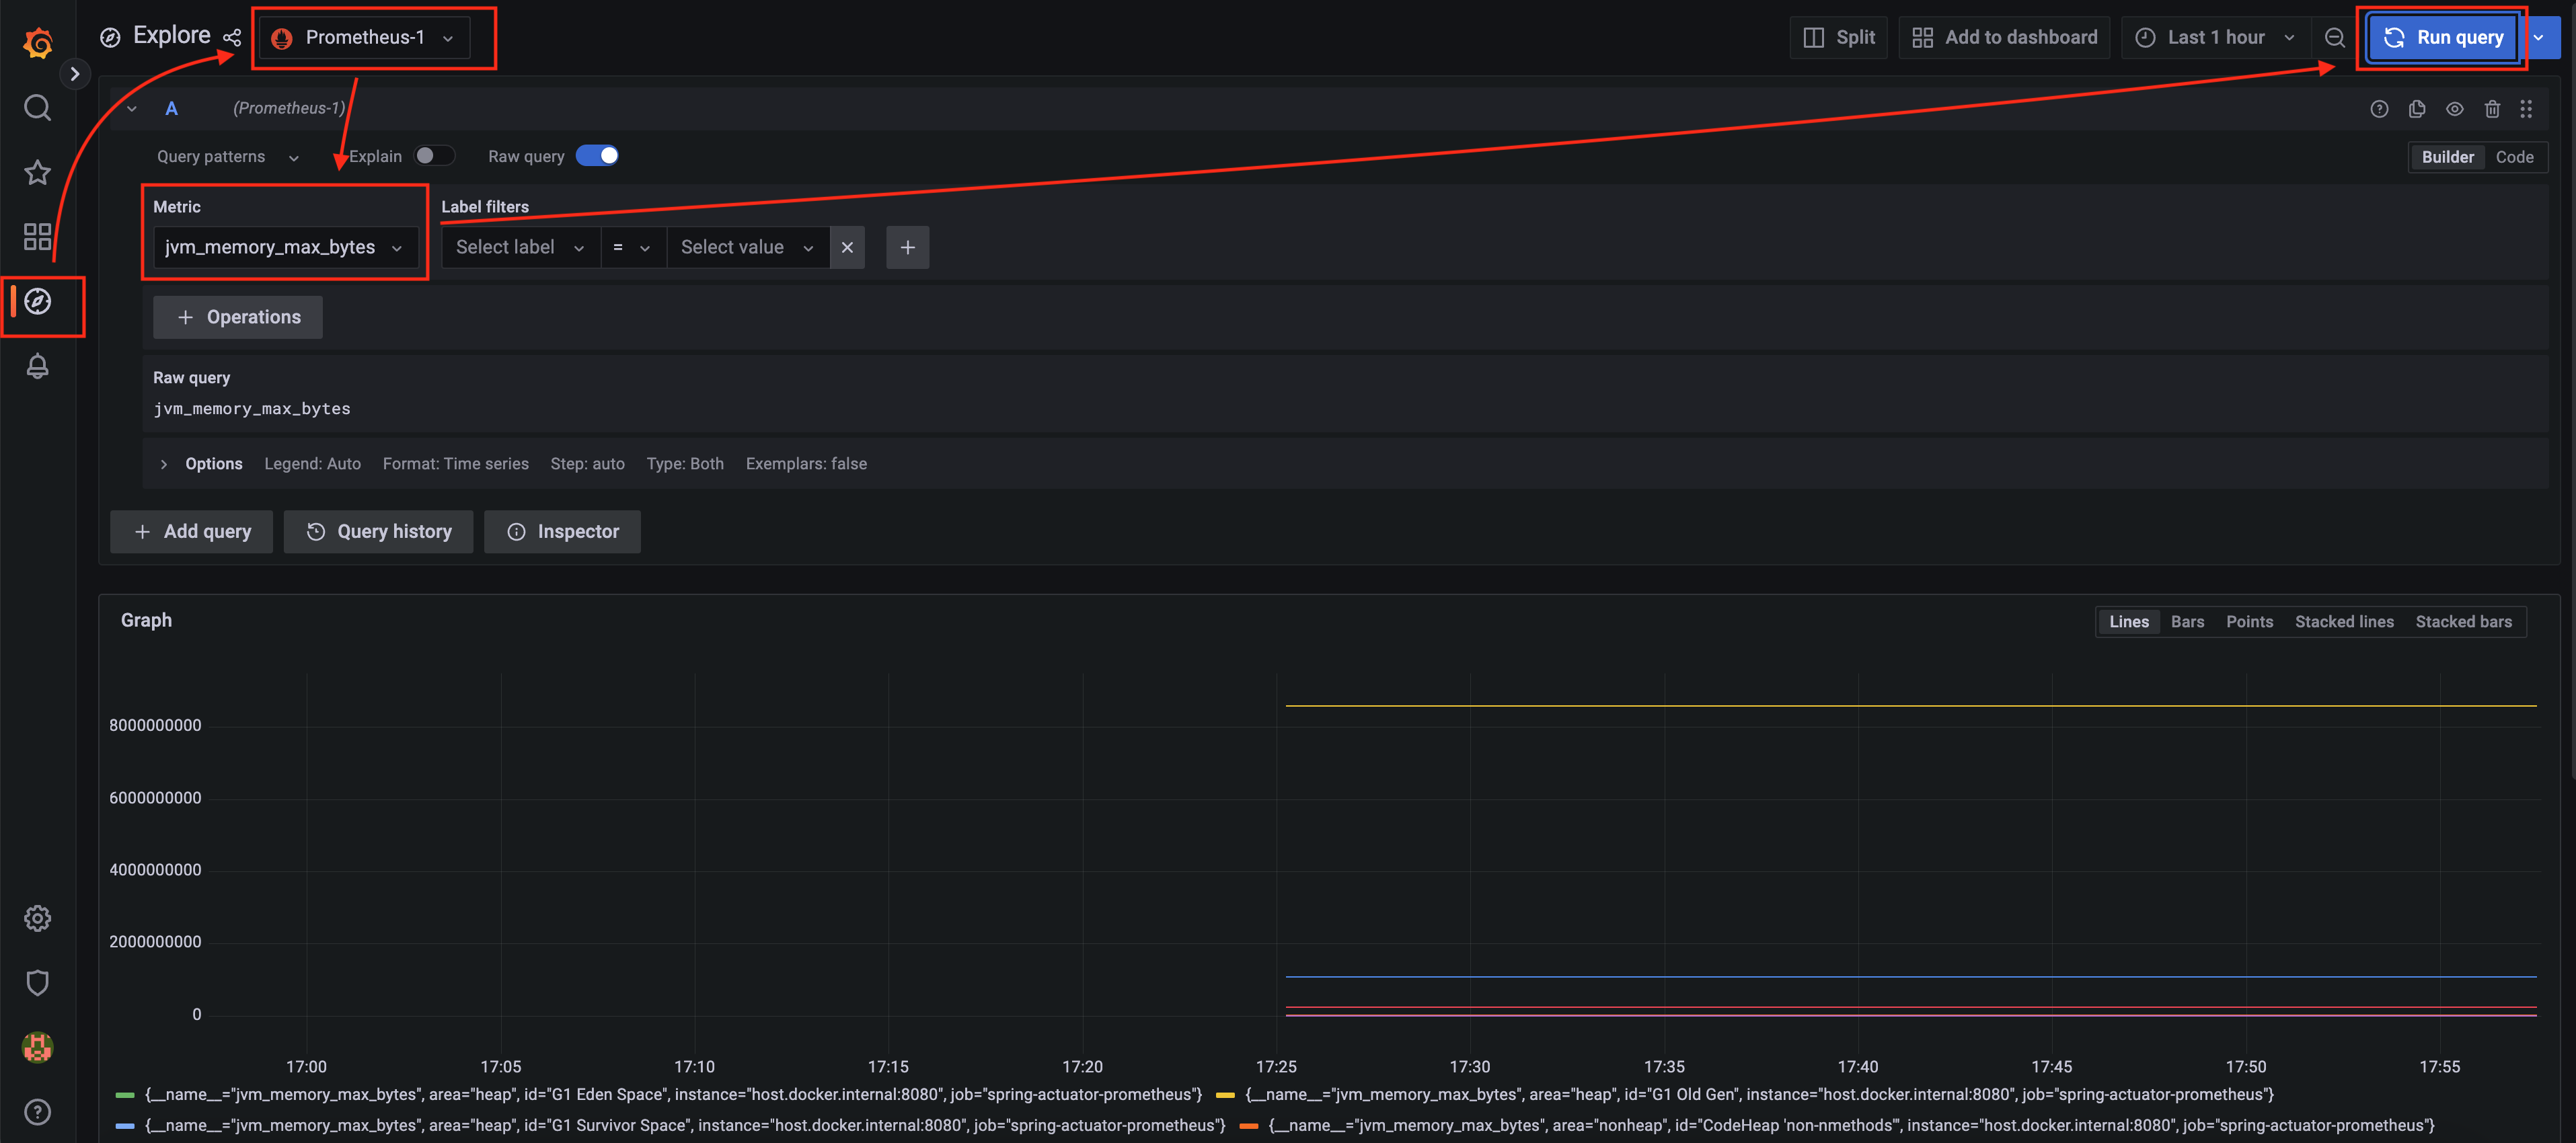
次に、Exploreアイコンを押して、Metricにjvm_memory_max_bytesを選択し、Run queryボタンを押す。
すると、次のようなグラフチャートを確認できる。
Add to dashboardボタンを押すと、Add panel to dashboard画面が表示される。
ここでNew dashboardを選択し、Open dashboardボタンを押す。

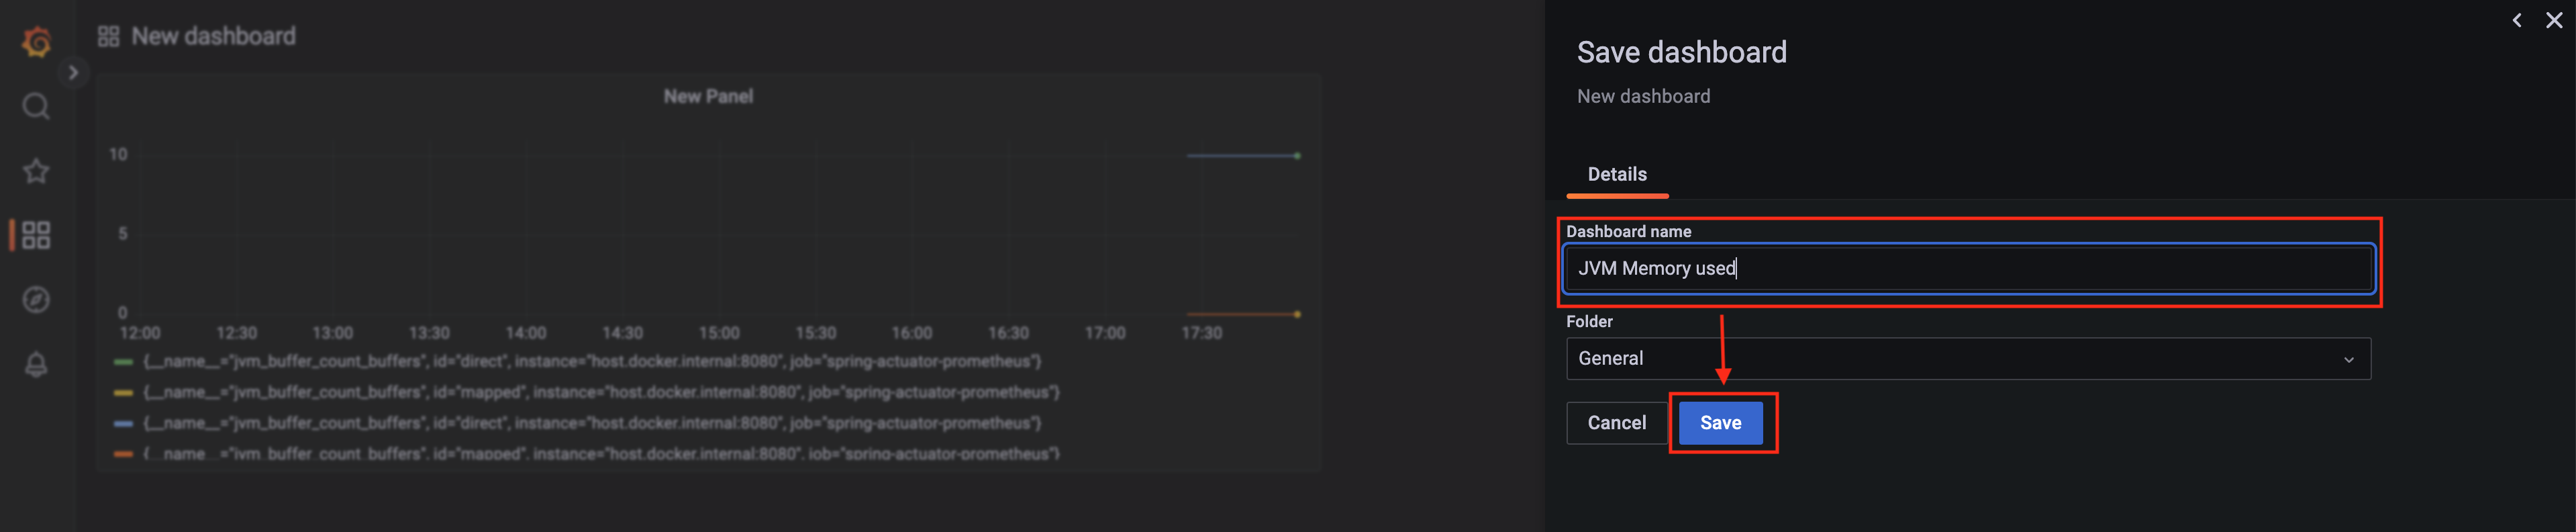
Save dashboard画面でDashboard nameを入力し、Saveボタンを押して保存する。
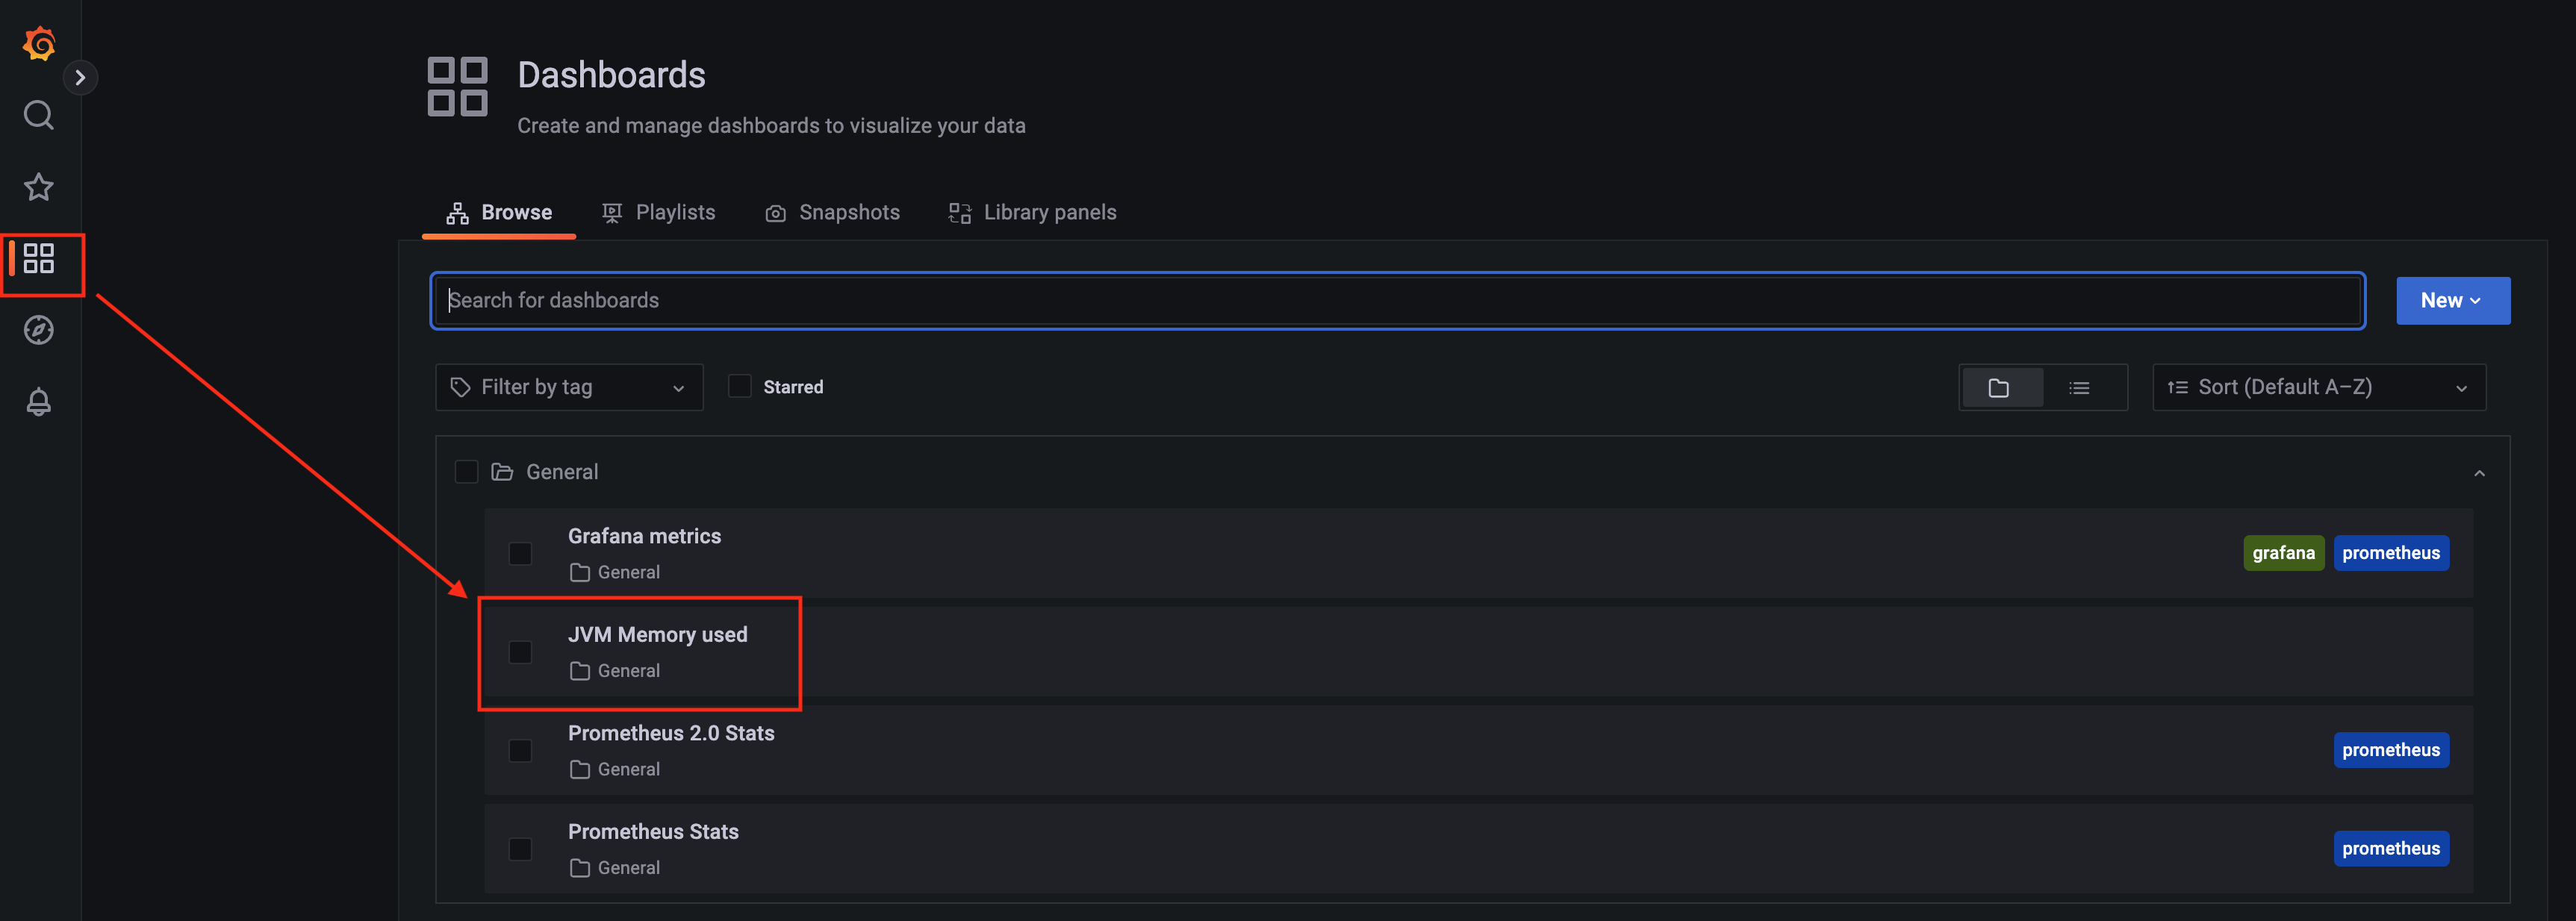
次に左側のDashboardアイコンをクリックし、先ほど入力した名前のJVM Memory used項目を選択する。
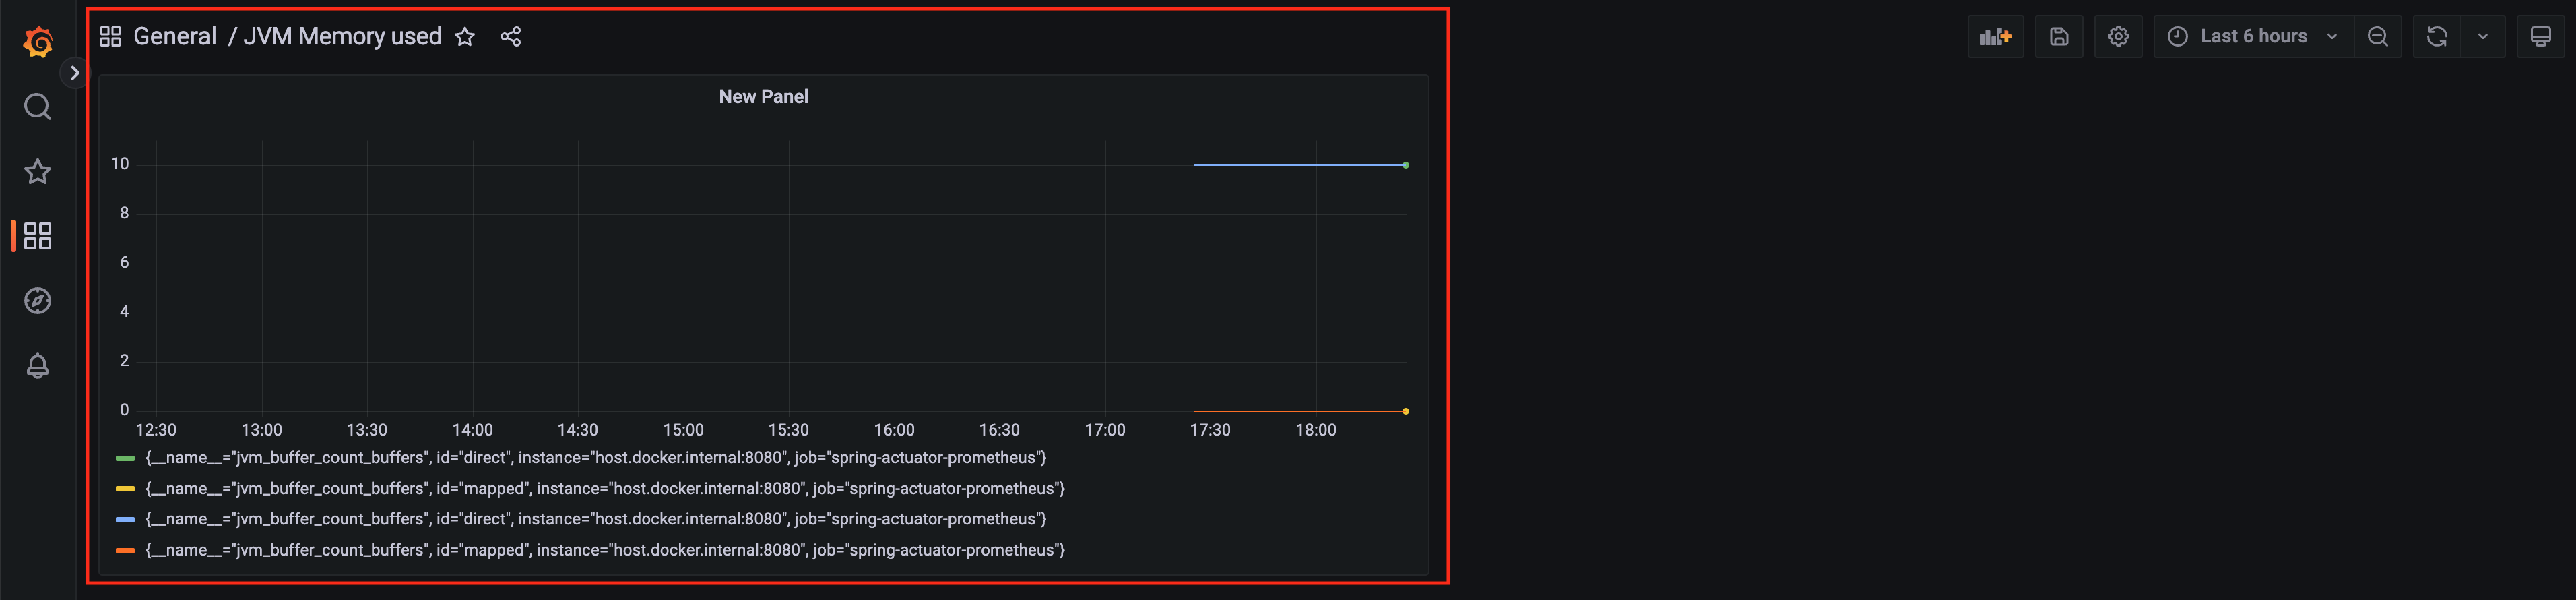
すると、次のようなチャートを確認できる。
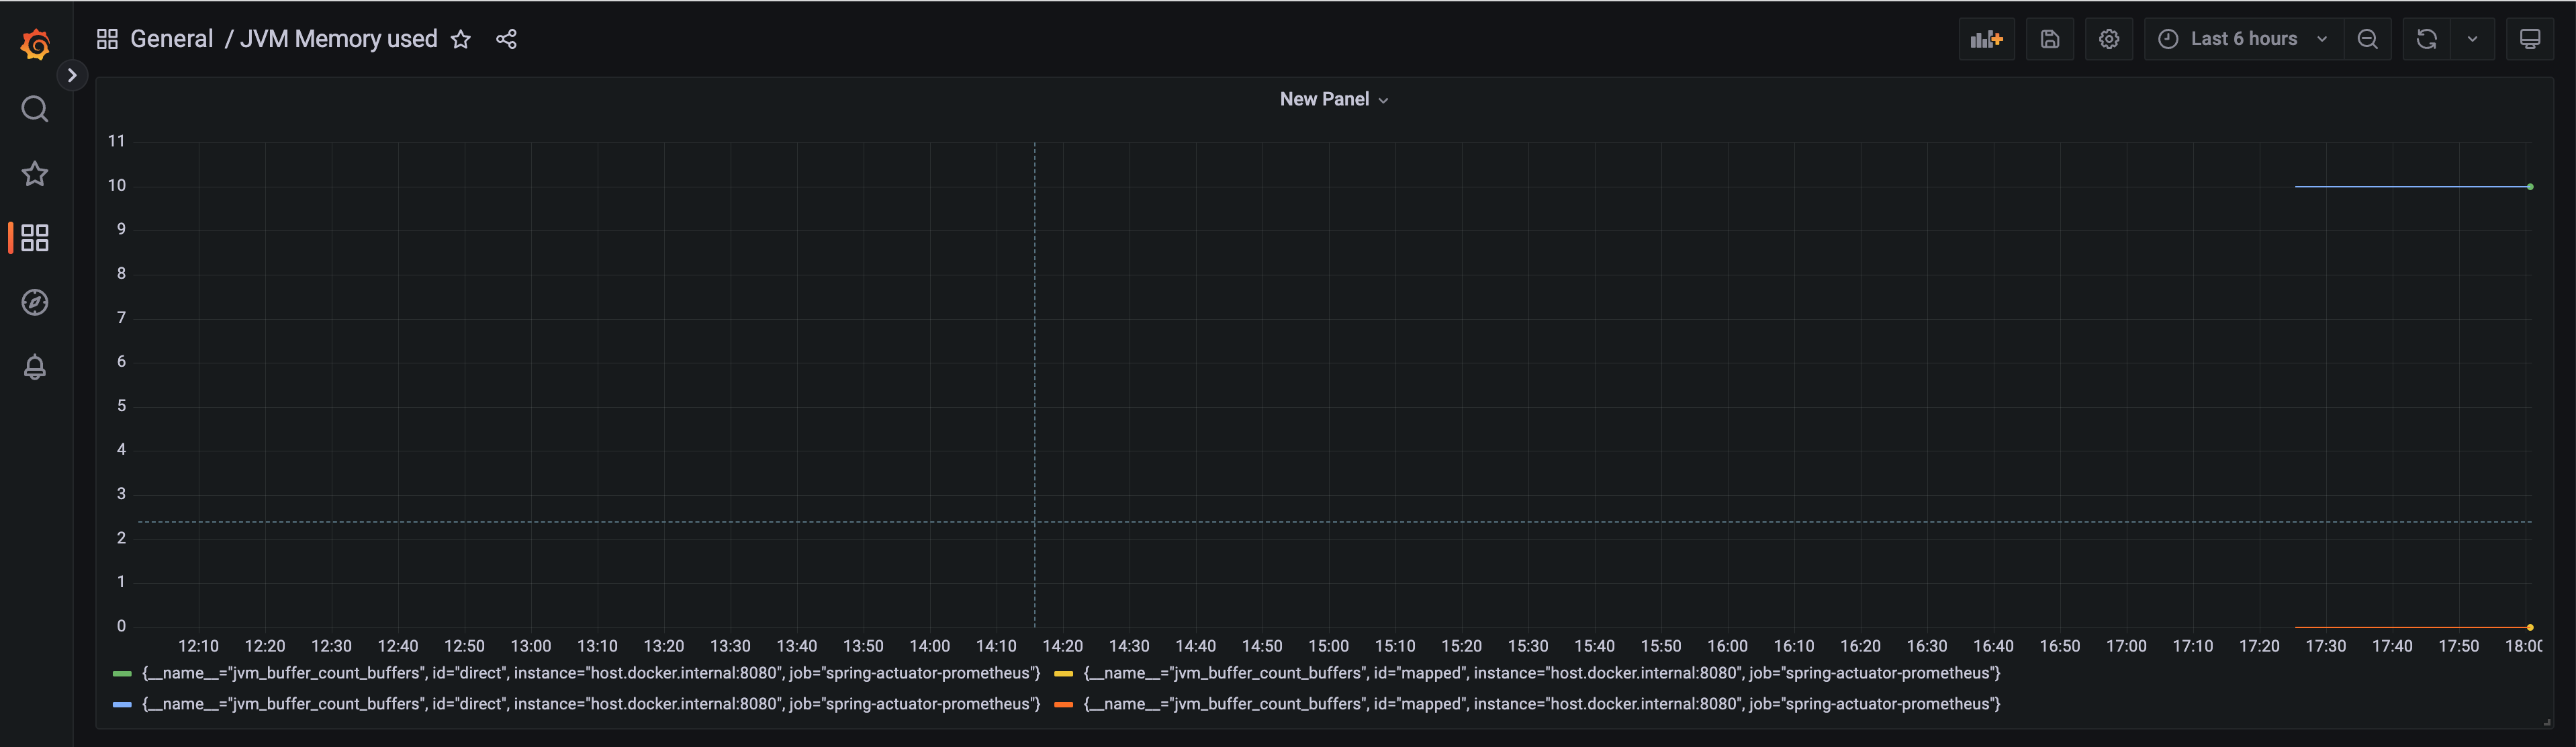
このチャートはマウスで横に広げることができ、保存もできる。
参考
- 上記で完成したプロジェクトコードはこちらに置いてある。
- Micrometer Application Monitoring | concepts
- SpringBoot Applicationのmonitoringシステム構築