D3.js overview
What is D3.js?
D3.js (Data-Driven Documents) is a JavaScript library for data visualization. It is so well known that D3.js is often mentioned when people talk about data visualization. D3 is an abbreviation, and it lets you build a data visualization framework on the web.
Unlike some other libraries, D3 does not simply draw a chart when you pass data to a function. Instead, it converts prepared data into drawing data and builds the screen based on the transformed data. You need to combine several steps to create a single display, but compared with other libraries it is extremely flexible, so if you have an idea, you can create many unusual visual expressions.
The official gallery contains many samples, so you can get a feel for what is possible.
All you need for development is a text editor such as Notepad, Visual Studio Code, or Sublime Text, and a browser such as Google Chrome. You can start easily and for free. The license is also free, using the modified BSD license, so commercial use is possible.
Useful prior knowledge includes HTML, JavaScript, CSS, and SVG or Canvas, but this guide explains the basics so that even readers without that knowledge can begin using D3.
With D3, you can create SVG charts conveniently. They are represented as SVG objects in an HTML document, styled with CSS, and manipulated with JavaScript.
Why use D3.js?
- It is very flexible.
- It is easy to use and fast.
- It supports large data sets.
- It uses a declarative approach.
- It improves code reusability.
- It can create a variety of curves.
- It connects data to an HTML page.
D3 often uses JSON as a data format. If you run it locally when using JSON files, it may not run because of JavaScript security policies and cross-browser issues. Therefore, when using JSON files, it is better to run the page through Node.js or Tomcat.
How D3.js works
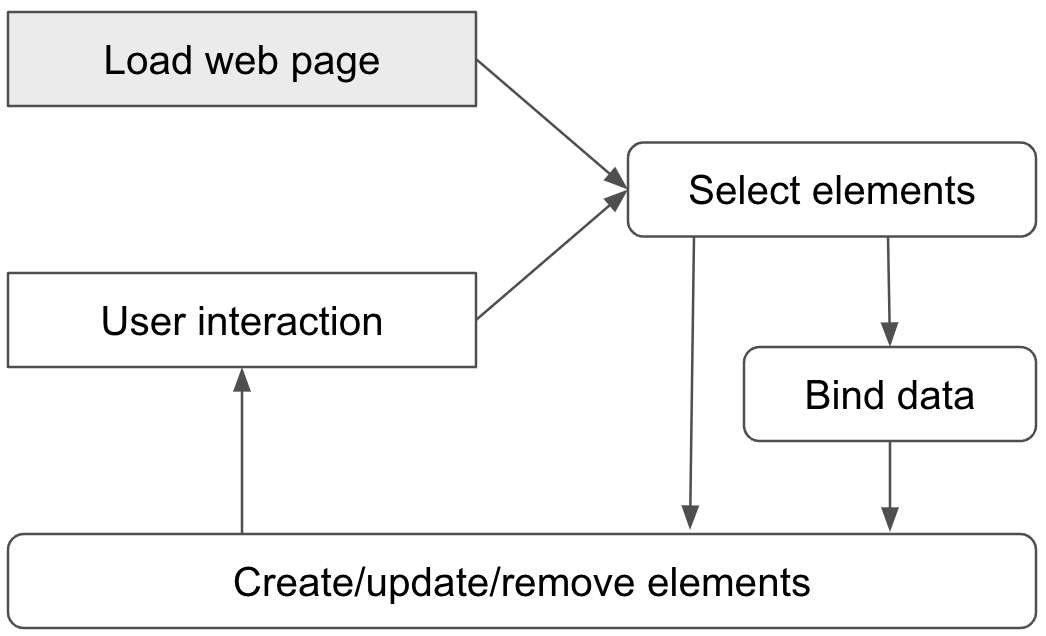
D3.js works in the following order.
Loading data
- Before drawing visual elements, load the data you want to show into browser memory.
- Various data formats such as
.tsv,.csv, and.jsoncan be connected.
Selecting and binding data
- Connect the data to visual elements.
- Bind the data values to the code that fills visual elements.
- Create the required HTML document elements and bind the data to them.
Transforming visual elements
- Define the visual representation of the data.
- Transform each document element based on the individual data bound to it.
- Specify various elements such as graph type, element colors, axes, and legends.
- Layout code is provided for graph types such as pies and treemaps.
Defining user reactions (transition)
- Effects can be defined for user reactions such as clicks and drags.
- In response to user input, document elements transition from one state to another.
How to use D3.js
Now look at how to use D3.js.
Download and use it
You can download d3.js from the official site below and place it directly in your folder.
Use it from a CDN
You can also use it by adding the following code.
<script src="https://d3js.org/d3.v7.min.js"></script>
Setting up the environment
First, prepare a text editor and copy the following text.
<!DOCTYPE html>
<html>
  <head>
    <meta charset="utf-8">
    <title>D3 Test</title>
    <script src="https://d3js.org/d3.v7.min.js"></script>
  </head>
  <body>
    <script>
      // Write code here.
    </script>
  </body>
</html>
You can use Notepad as the text editor, but programs such as Visual Studio Code and Sublime Text are recommended because they color-code functions and run lightly.
After copying the text, save it with an appropriate file name in a suitable location. Here it is saved as index.html.
After saving, open it in Google Chrome. There are several ways to open it in Google Chrome, but the easiest way is to open Google Chrome first and drop the file into it.
A blank white screen should open as shown below.
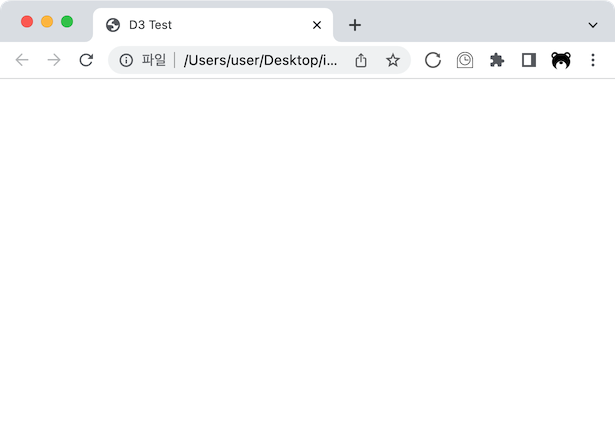
Now add an element to this white screen.
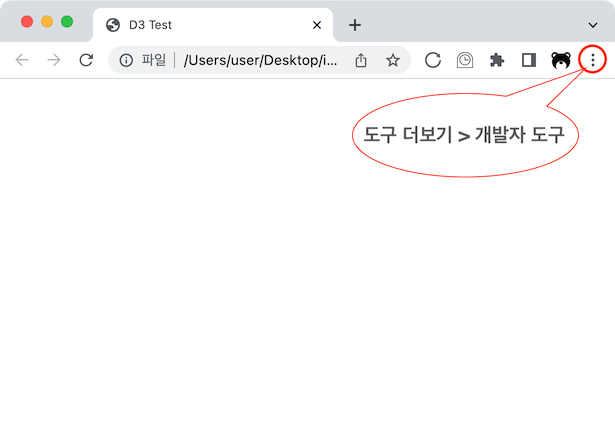
Before explaining D3.js, here is a quick look at Google Chrome Developer Tools. Click the dots in the upper-right corner of the screen, shown in red below, open the menu, and choose “More tools” -> “Developer tools”.
Then information like the following appears.
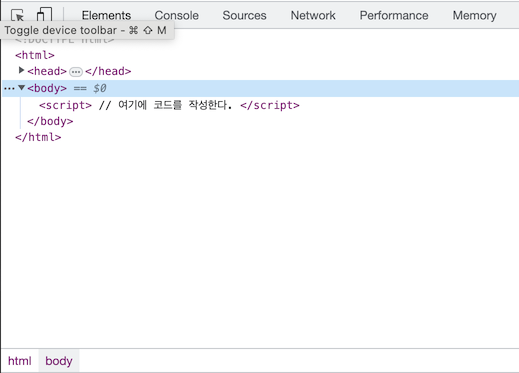
It shows the current structure of index.html. If the head information is collapsed, click the triangle to the left of <head> to display it.
Header information such as the title is written between <head> and </head>, and the body of the document actually displayed in the browser is written between <body> and </body>. The <script> tag is used to write JavaScript code.
Inside the <head> tag, the D3.js library is loaded as follows so that it can be used.
<script src="https://d3js.org/d3.v7.min.js"></script>
The version used here is v7. To use another version, modify this part.