Installing Elasticsearch, Kibana, and Cerebro
Install from downloaded files
Install Java
Elasticsearch runs on the JVM, so Java 8 (JDK) must be installed.
If it is not installed, install the JDK first.
Install the Java 8 (JDK) runtime.
$ sudo yum install java-1.8.0-openjdk -y
Install the Java 8 (JDK) development environment.
$ sudo yum install java-1.8.0-openjdk-devel -y
Check the Java version.
$ java -version
openjdk version "1.8.0_252"
OpenJDK Runtime Environment (build 1.8.0_252-b09)
OpenJDK 64-Bit Server VM (build 25.252-b09, mixed mode)
Install Elasticsearch
Now install Elasticsearch.
First, download the installation file.
$ wget https://artifacts.elastic.co/downloads/kibana/kibana-7.14.1-linux-x86_64.tar.gz
Extract the downloaded file.
$ tar xvfz elasticsearch-7.14.1-linux-x86_64.tar.gz
Rename the directory to a shorter, easier-to-use name.
$ mv files/elasticsearch-7.14.1-linux-x86_64/ es-714
Move to the bin directory.
$ cd es-714/bin/
Run the startup file.
$ ./elasticsearch
[kimkc@localhost bin]$ ./elasticsearch
[2021-09-02T21:45:57,952][INFO ][o.e.n.Node               ] [localhost.localdomain] version[7.14.1], pid[116654], build[default/tar/66b55ebfa59c92c15db3f69a335d500018b3331e/2021-08-26T09:01:05.390870785Z], OS[Linux/4.18.0-338.el8.x86_64/amd64], JVM[Eclipse Foundation/OpenJDK 64-Bit Server VM/16.0.2/16.0.2+7]
[2021-09-02T21:45:57,957][INFO ][o.e.n.Node               ] [localhost.localdomain] JVM home [/home/kimkc/es-714/jdk], using bundled JDK [true]
[2021-09-02T21:45:57,958][INFO ][o.e.n.Node               ] [localhost.localdomain] JVM arguments [-Xshare:auto, -Des.networkaddress.cache.ttl=60, -Des.networkaddress.cache.negative.ttl=10, -XX:+AlwaysPreTouch, -Xss1m, -Djava.awt.headless=true, -Dfile.encoding=UTF-8, -Djna.nosys=true, -XX:-OmitStackTraceInFastThrow, -XX:+ShowCodeDetailsInExceptionMessages, -Dio.netty.noUnsafe=true, -Dio.netty.noKeySetOptimization=true, -Dio.netty.recycler.maxCapacityPerThread=0, -Dio.netty.allocator.numDirectArenas=0, -Dlog4j.shutdownHookEnabled=false, -Dlog4j2.disable.jmx=true, -Djava.locale.providers=SPI,COMPAT, --add-opens=java.base/java.io=ALL-UNNAMED, -XX:+UseG1GC, -Djava.io.tmpdir=/tmp/elasticsearch-1671236956648459411, -XX:+HeapDumpOnOutOfMemoryError, -XX:HeapDumpPath=data, -XX:ErrorFile=logs/hs_err_pid%p.log, -Xlog:gc*,gc+age=trace,safepoint:file=logs/gc.log:utctime,pid,tags:filecount=32,filesize=64m, -Xms166m, -Xmx166m, -XX:MaxDirectMemorySize=87031808, -XX:G1HeapRegionSize=4m, -XX:InitiatingHeapOccupancyPercent=30, -XX:G1ReservePercent=15, -Des.path.home=/home/kimkc/es-714, -Des.path.conf=/home/kimkc/es-714/config, -Des.distribution.flavor=default, -Des.distribution.type=tar, -Des.bundled_jdk=true]
[2021-09-02T21:46:00,777][INFO ][o.e.p.PluginsService     ] [localhost.localdomain] loaded module [aggs-matrix-stats]
[2021-09-02T21:46:00,778][INFO ][o.e.p.PluginsService     ] [localhost.localdomain] loaded module [analysis-common]
[2021-09-02T21:46:00,778][INFO ][o.e.p.PluginsService     ] [localhost.localdomain] loaded module [constant-keyword]
[2021-09-02T21:46:00,779][INFO ][o.e.p.PluginsService     ] [localhost.localdomain] loaded module [frozen-indices]
[2021-09-02T21:46:00,779][INFO ][o.e.p.PluginsService     ] [localhost.localdomain] loaded module [ingest-common]

... omitted ...
Check whether it is accessible.
$ curl -XGET localhost:9200
$ curl -XGET localhost:9200
{
  "name" : "es-714",
  "cluster_name" : "elasticsearch",
  "cluster_uuid" : "8mO5vPIJQS-Eqa3PUvBVcA",
  "version" : {
    "number" : "7.14.1",
    "build_flavor" : "default",
    "build_type" : "tar",
    "build_hash" : "66b55ebfa59c92c15db3f69a335d500018b3331e",
    "build_date" : "2021-08-26T09:01:05.390870785Z",
    "build_snapshot" : false,
    "lucene_version" : "8.9.0",
    "minimum_wire_compatibility_version" : "6.8.0",
    "minimum_index_compatibility_version" : "6.0.0-beta1"
  },
  "tagline" : "You Know, for Search"
}
[kimkc@es-714 ~]$
If it runs as shown above, the installation completed successfully.
Install Kibana
Download the installation file.
$ wget https://artifacts.elastic.co/downloads/kibana/kibana-7.14.1-linux-x86_64.tar.gz
Extract the downloaded file.
$ tar xvfz kibana-7.14.1-linux-x86_64.tar.gz
Rename the directory to a shorter, easier-to-use name.
$ mv files/kibana-7.14.1-linux-x86_64/ kb-714
Move to the bin directory.
$ cd kb-714/bin/
Run the startup file.
$ ./kibana
Install with Docker
For simple learning or experimentation, installing with Docker is recommended.
Install Elasticsearch with Docker
Download the Elasticsearch Docker image
Run the following command to download the Elasticsearch Docker image. Here, version 7.14.0 is used.
docker pull docker.elastic.co/elasticsearch/elasticsearch:7.14.0
The result is as follows.
% docker pull docker.elastic.co/elasticsearch/elasticsearch:7.14.0
7.14.0: Pulling from elasticsearch/elasticsearch
ddf49b9115d7: Pull complete
693712dd4782: Pull complete
e1843b23879c: Pull complete
43b0526f3562: Pull complete
395a8174c4c5: Pull complete
671bce37ebcd: Pull complete
7b0bb020b357: Pull complete
Digest: sha256:46815a329dfdf633cac9261e287c8440512db13554cbcb4fa89842dde58e74b2
Status: Downloaded newer image for docker.elastic.co/elasticsearch/elasticsearch:7.14.0
docker.elastic.co/elasticsearch/elasticsearch:7.14.0
Create and run the Elasticsearch Docker container
Run the following command. The Docker container name is set to es714.
docker run -d -p 9200:9200 -p 9300:9300 -e "discovery.type=single-node" --name es714 docker.elastic.co/elasticsearch/elasticsearch:7.14.0
The result is as follows.
% docker run -d -p 9200:9200 -p 9300:9300 -e "discovery.type=single-node" --name es714 [docker.elastic.co/elasticsearch/elasticsearch:7.14.0](http://docker.elastic.co/elasticsearch/elasticsearch:7.14.0)
a3b75abf13c211cadf86637fe1c457b4b465556fc231a9a243362da49b117952
Check the Elasticsearch Docker container
Run the following command to check that the container is running.
docker ps
The result is as follows.
% docker ps
CONTAINER ID   IMAGE                                                  COMMAND                  CREATED              STATUS              PORTS                                                                                  NAMES
a3b75abf13c2   docker.elastic.co/elasticsearch/elasticsearch:7.14.0   "/bin/tini -- /usr/l..."   About a minute ago   Up About a minute   0.0.0.0:9200->9200/tcp, :::9200->9200/tcp, 0.0.0.0:9300->9300/tcp, :::9300->9300/tcp   es714
Check the Elasticsearch Docker settings
Run the following command to check the settings.
docker exec -i -t es714 cat /usr/share/elasticsearch/config/elasticsearch.yml
The result is as follows.
% docker exec -i -t es714 cat /usr/share/elasticsearch/config/elasticsearch.yml
cluster.name: "docker-cluster"
network.host: 0.0.0.0
Install Kibana with Docker
Pull the Kibana Docker image
Run the following command to pull the Kibana Docker image. Use the same version as Elasticsearch, 7.14.0.
docker pull docker.elastic.co/kibana/kibana:7.14.0
The result is as follows.
% docker pull docker.elastic.co/kibana/kibana:7.14.0
7.14.0: Pulling from kibana/kibana
ddf49b9115d7: Already exists
b62151c99641: Pull complete
d11b460fe76c: Pull complete
1078fcc7cd25: Pull complete
c74f7ca3ab86: Pull complete
2fb0a75edcfc: Pull complete
339c3eb65140: Pull complete
c359ec1d1586: Pull complete
7c0bddf401bf: Pull complete
59df587bba1b: Pull complete
34afeb086a05: Pull complete
4de583c3a000: Pull complete
961084329244: Pull complete
Digest: sha256:6408b11743abb2855e62406edb3cfd53848b97e48c65c0f4d843c427ccb3bb90
Status: Downloaded newer image for docker.elastic.co/kibana/kibana:7.14.0
docker.elastic.co/kibana/kibana:7.14.0
Create and run the Kibana Docker container
Run the following command.
docker run -d --link es714:elasticsearch -p 5601:5601 --name kb714 docker.elastic.co/kibana/kibana:7.14.0
The result is as follows.
% docker run -d --link es714:elasticsearch -p 5601:5601 --name kb714 docker.elastic.co/kibana/kibana:7.14.0
becb75fdb608c119407ea37e1f75f54898d64683fdb76674b08e8c875e1fca77
Check the Kibana Docker container
Run the following command.
docker ps
The result is as follows.
% docker ps
CONTAINER ID   IMAGE                                                  COMMAND                  CREATED             STATUS             PORTS                                                                                  NAMES
becb75fdb608   docker.elastic.co/kibana/kibana:7.14.0                 "/bin/tini -- /usr/l..."   13 seconds ago      Up 12 seconds      0.0.0.0:5601->5601/tcp, :::5601->5601/tcp                                              kb714
a3b75abf13c2   docker.elastic.co/elasticsearch/elasticsearch:7.14.0   "/bin/tini -- /usr/l..."   About an hour ago   Up About an hour   0.0.0.0:9200->9200/tcp, :::9200->9200/tcp, 0.0.0.0:9300->9300/tcp, :::9300->9300/tcp   es714
Check the Kibana settings
Run the following command.
docker exec -i -t kb714 cat /usr/share/kibana/config/kibana.yml
The result is as follows.
% docker exec -i -t kb714 cat /usr/share/kibana/config/kibana.yml
#
# ** THIS IS AN AUTO-GENERATED FILE **
#

# Default Kibana configuration for docker target
server.host: "0"
server.shutdownTimeout: "5s"
elasticsearch.hosts: [ "http://elasticsearch:9200" ]
monitoring.ui.container.elasticsearch.enabled: true%
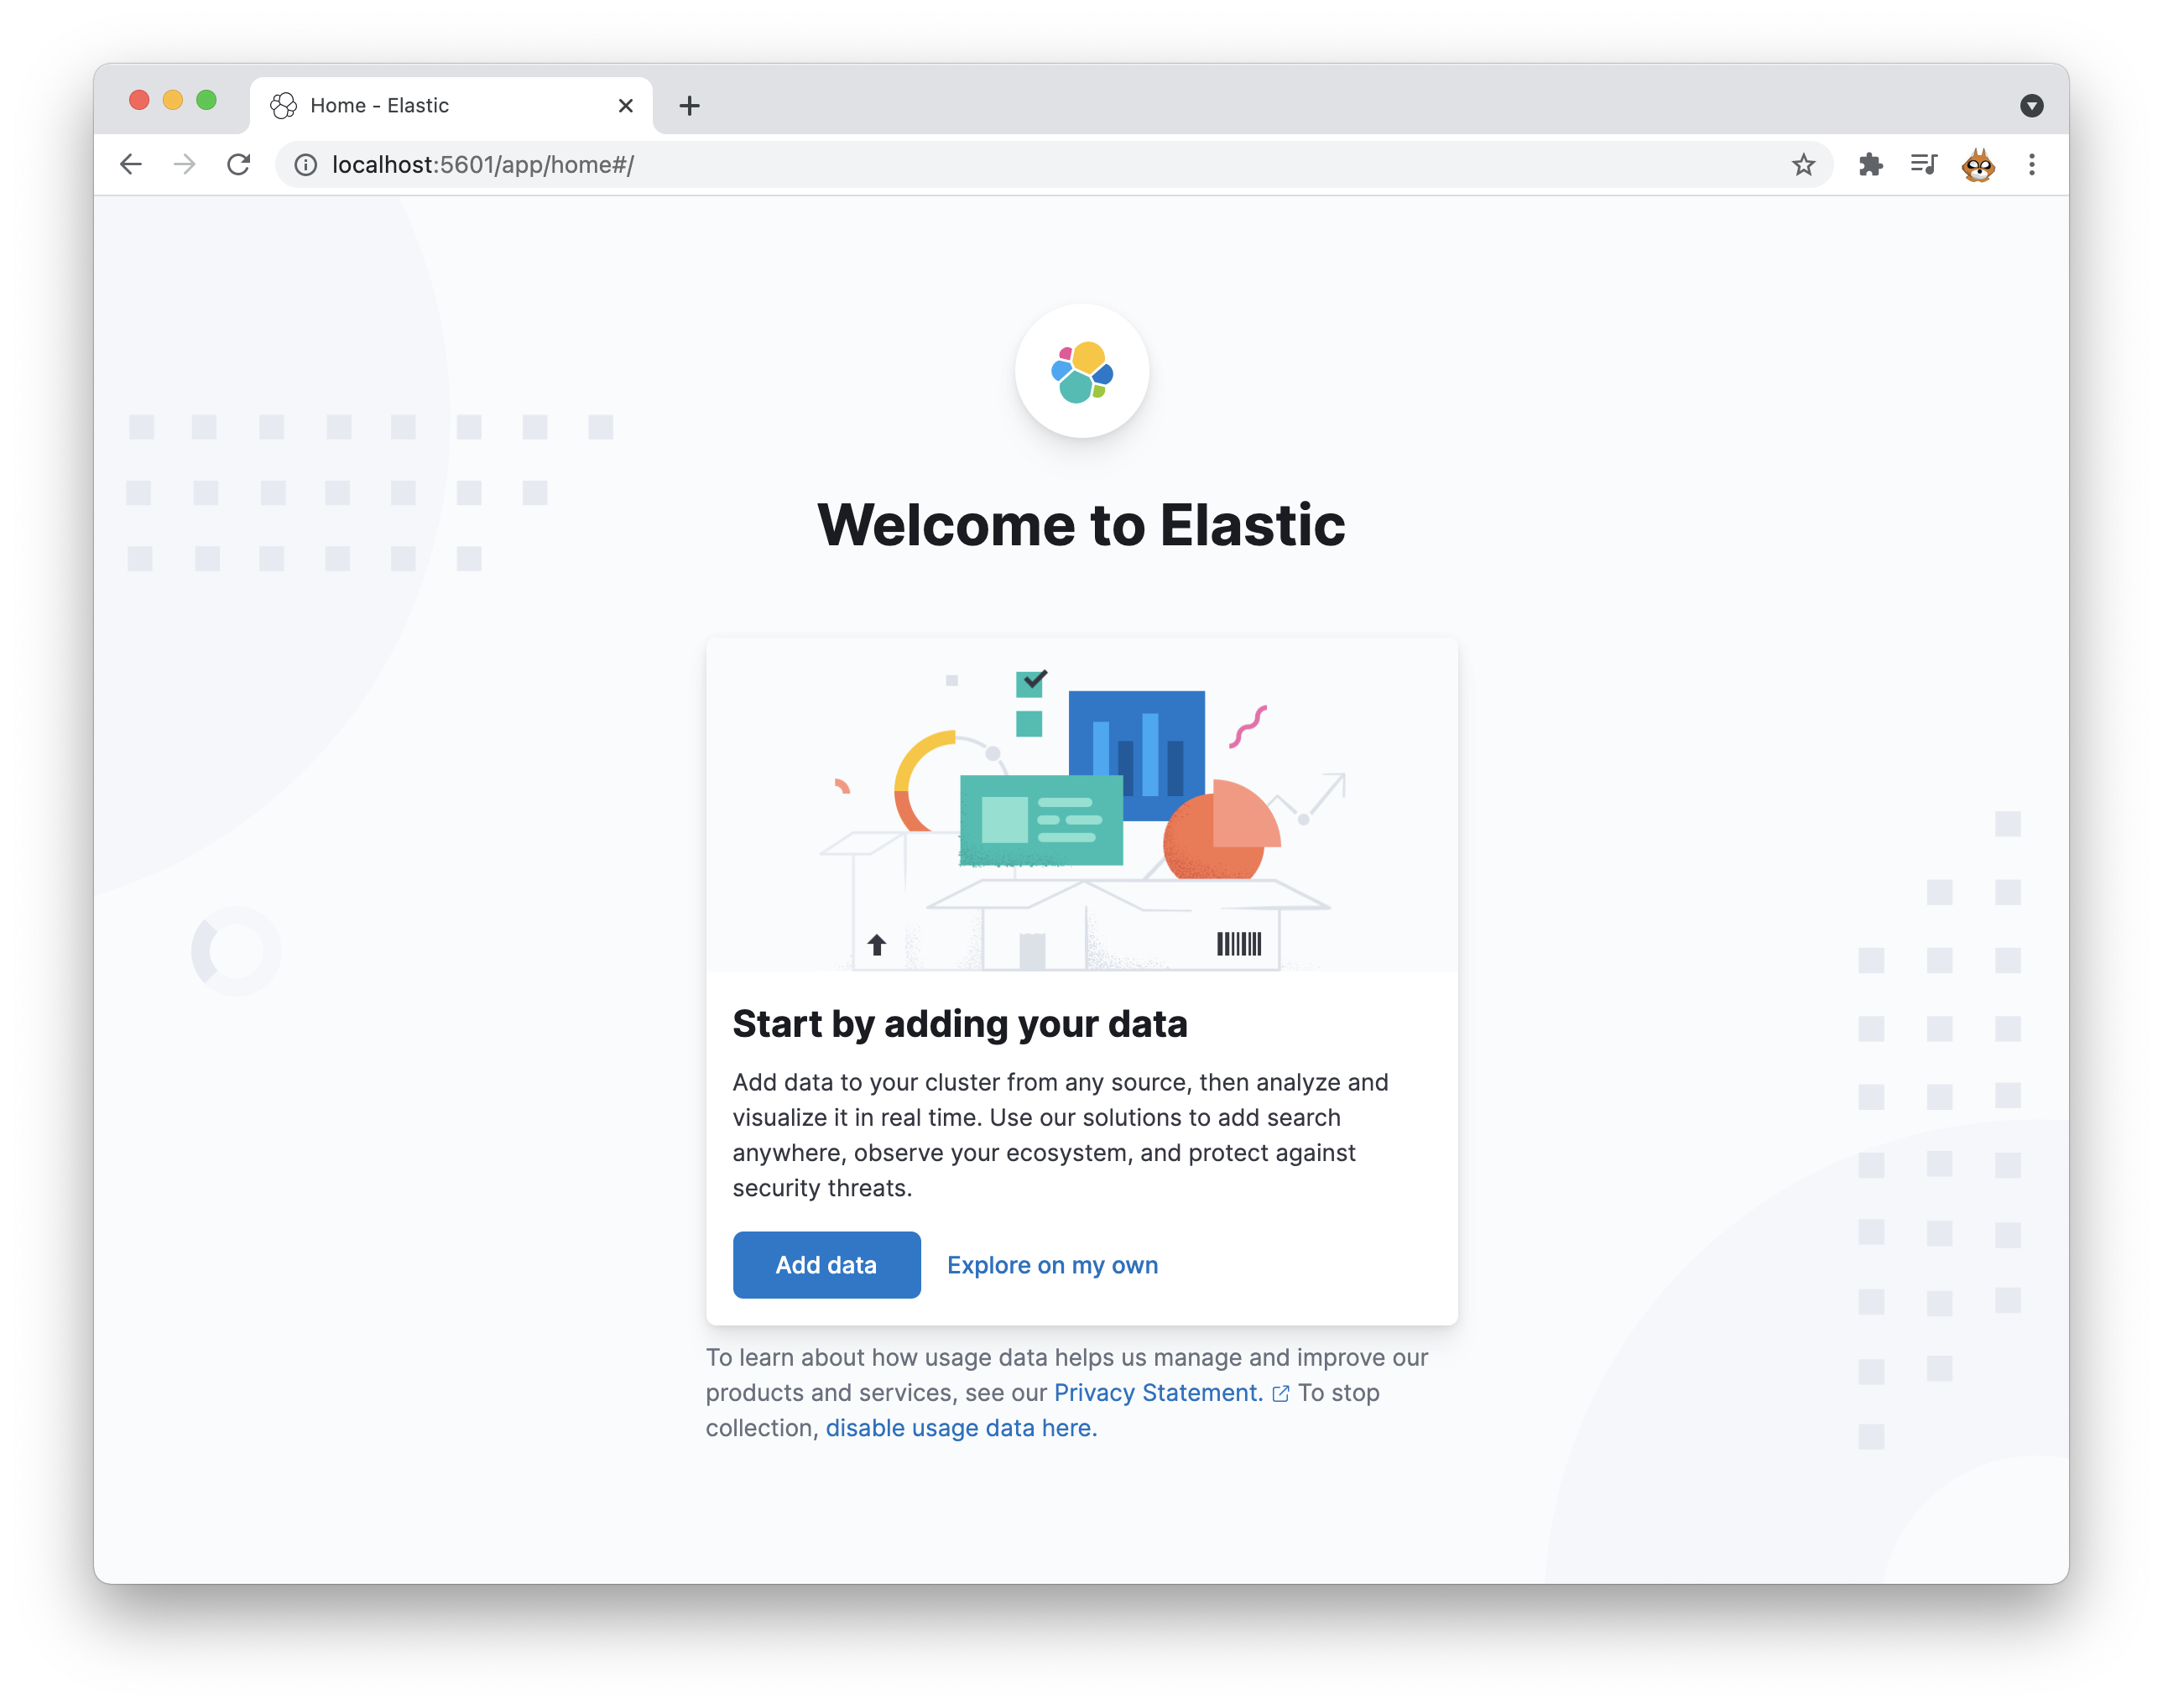
Check Kibana access
Enter the following URL in a browser.
http://localhost:5601/
If the following screen is displayed, the installation completed correctly.
Install Cerebro with Docker
Cerebro is another GUI tool for viewing Elasticsearch.
Pull the Cerebro Docker image
Run the following command to pull the Cerebro Docker image.
docker pull lmenezes/cerebro
The result is as follows.
% docker pull lmenezes/cerebro
Using default tag: latest
latest: Pulling from lmenezes/cerebro
f7ec5a41d630: Pull complete
faf4c47c8c61: Pull complete
810072571faf: Pull complete
395682a2fa05: Pull complete
635a13f1552d: Pull complete
Digest: sha256:95b02e46ec91c00ab33ce21f4d23bf6083d3c900257b9371a56ea218737462e5
Status: Downloaded newer image for lmenezes/cerebro:latest
docker.io/lmenezes/cerebro:latest
Run the Cerebro Docker container
Run the following command.
docker run -d -p 9000:9000 --link es714:localhost --name cerebro -e "CEREBRO_PORT=9000" -e "ELASTICSEARCH_HOST=http://localhost:9200" lmenezes/cerebro
The result is as follows.
% docker run -d -p 9000:9000 --link es714:localhost --name cerebro -e "CEREBRO_PORT=9000" -e "ELASTICSEARCH_HOST=http://localhost:9200" lmenezes/cerebro
4f1c86c5e3156891cb129a841579f1ff6446c271c4fa53141c23c3d0004613f7
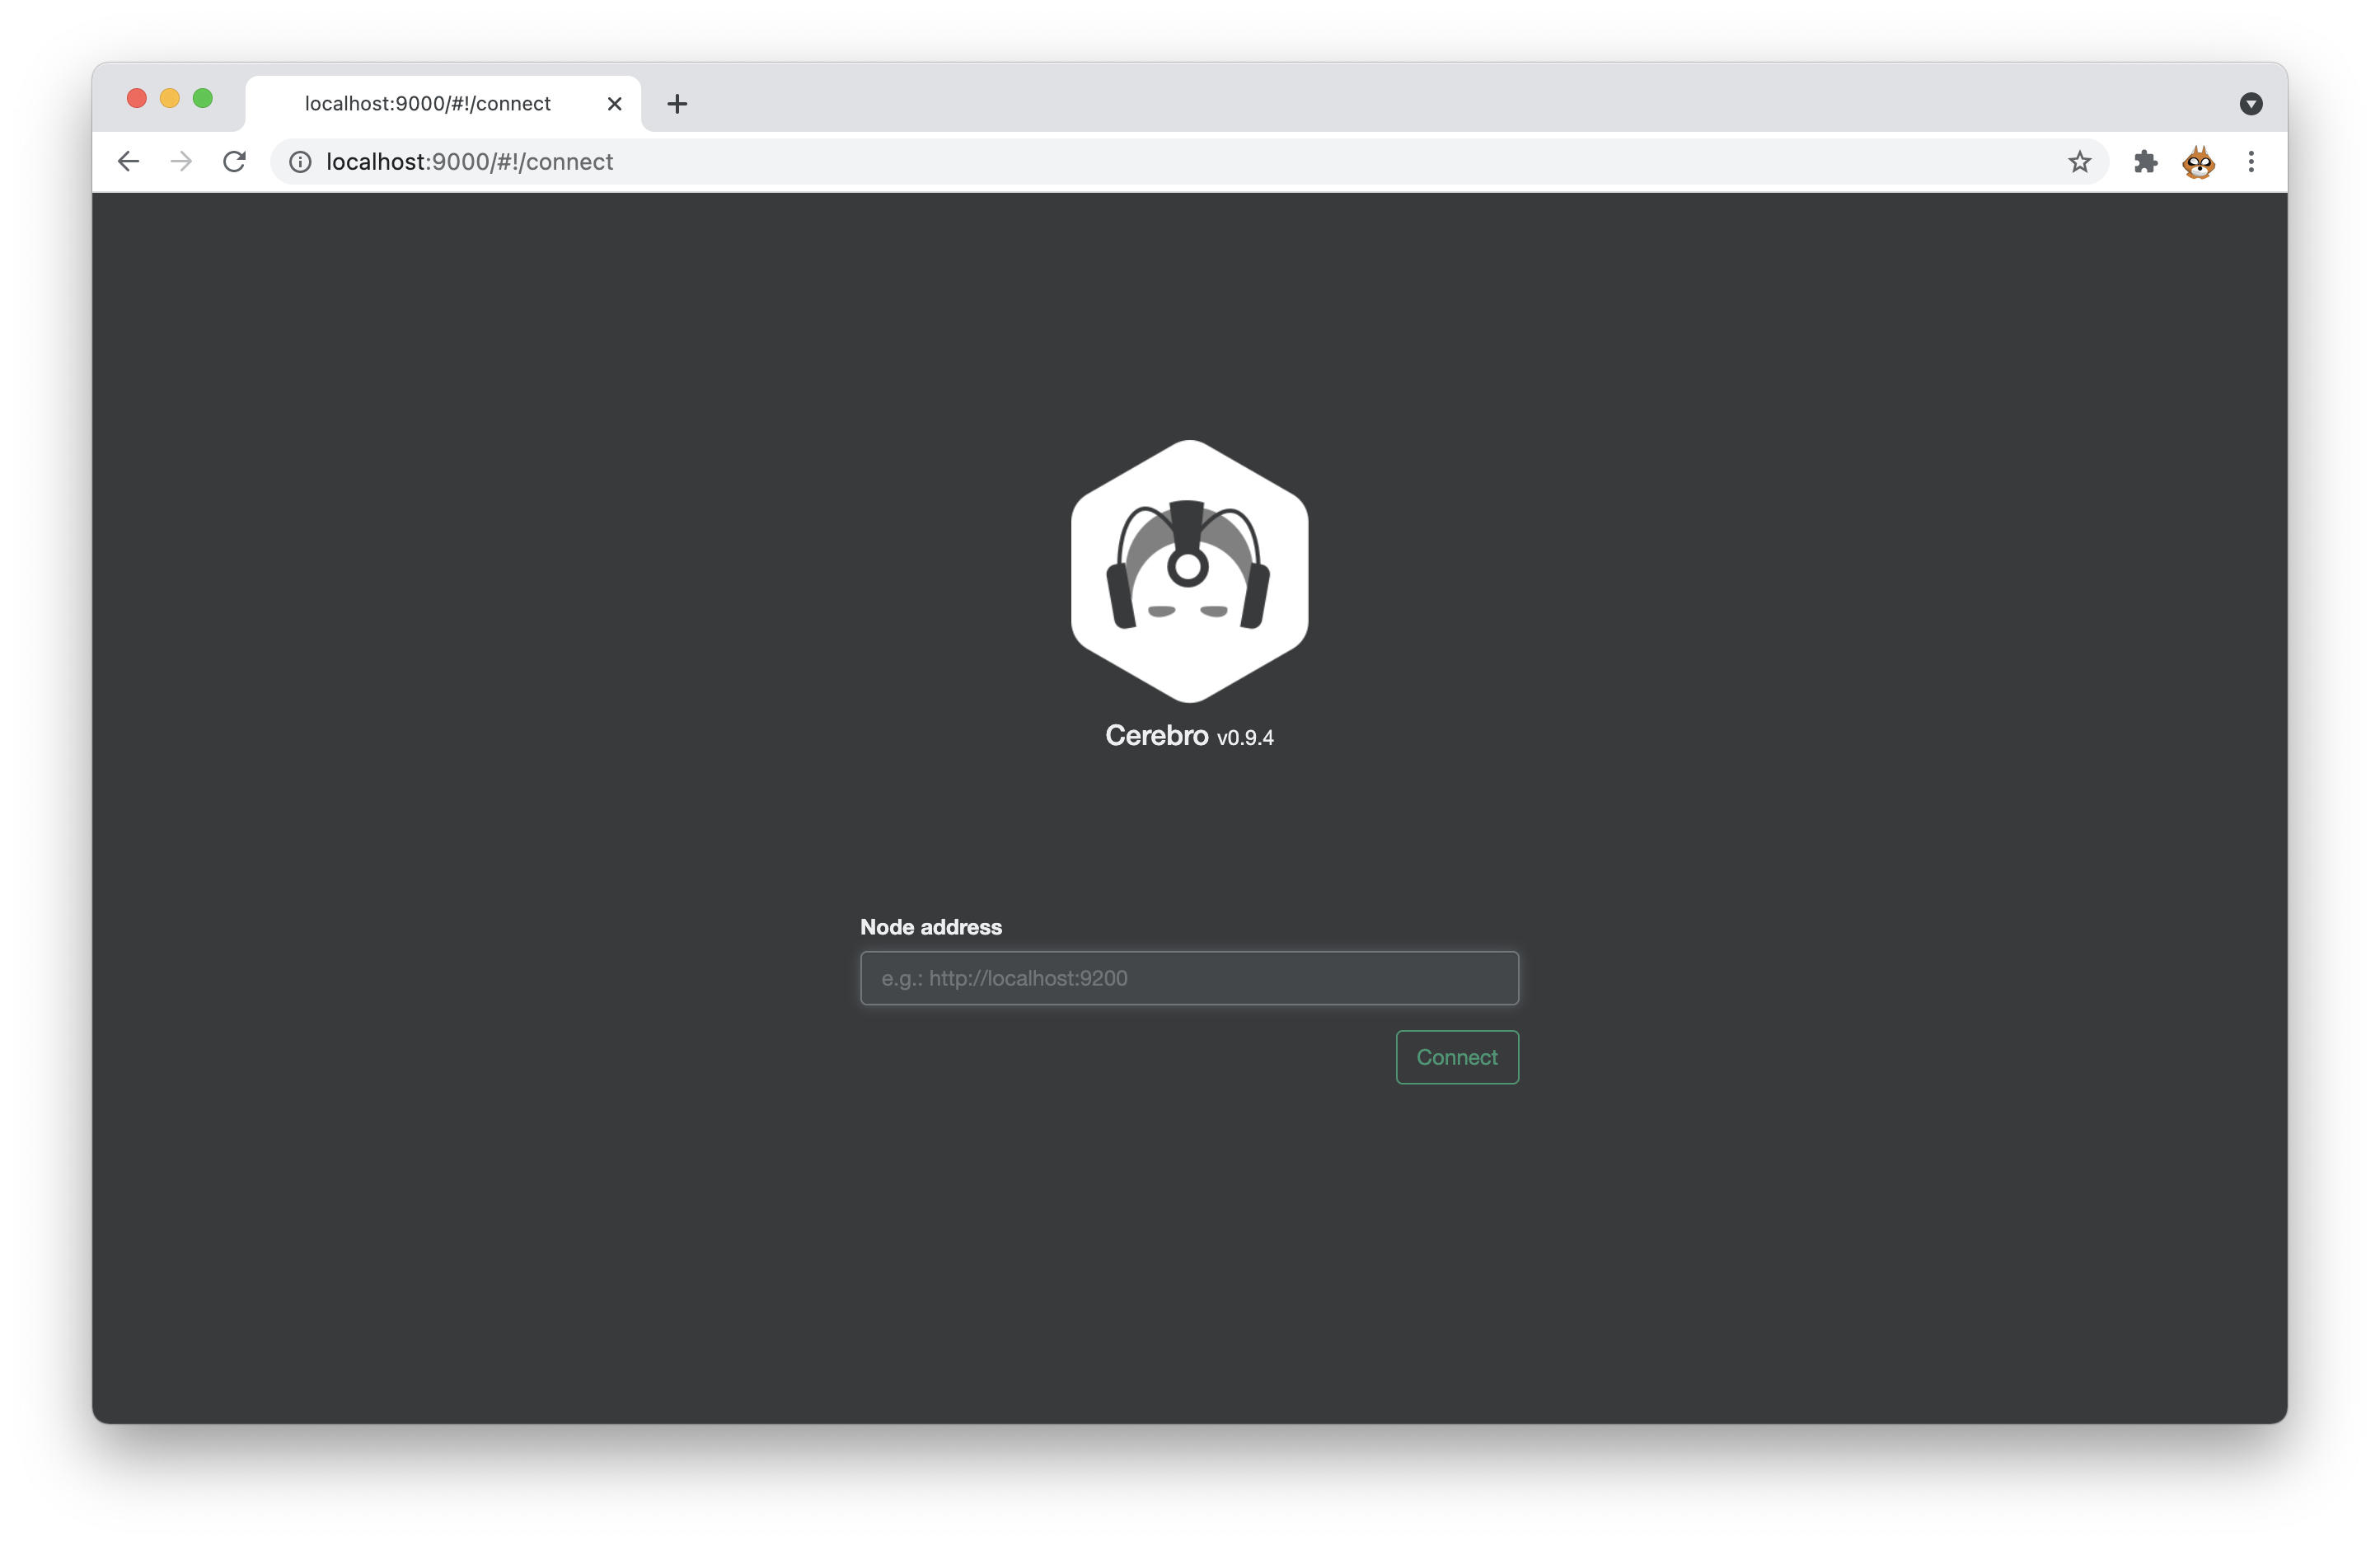
Check Cerebro access
Enter the following URL in a browser.
http://localhost:9000
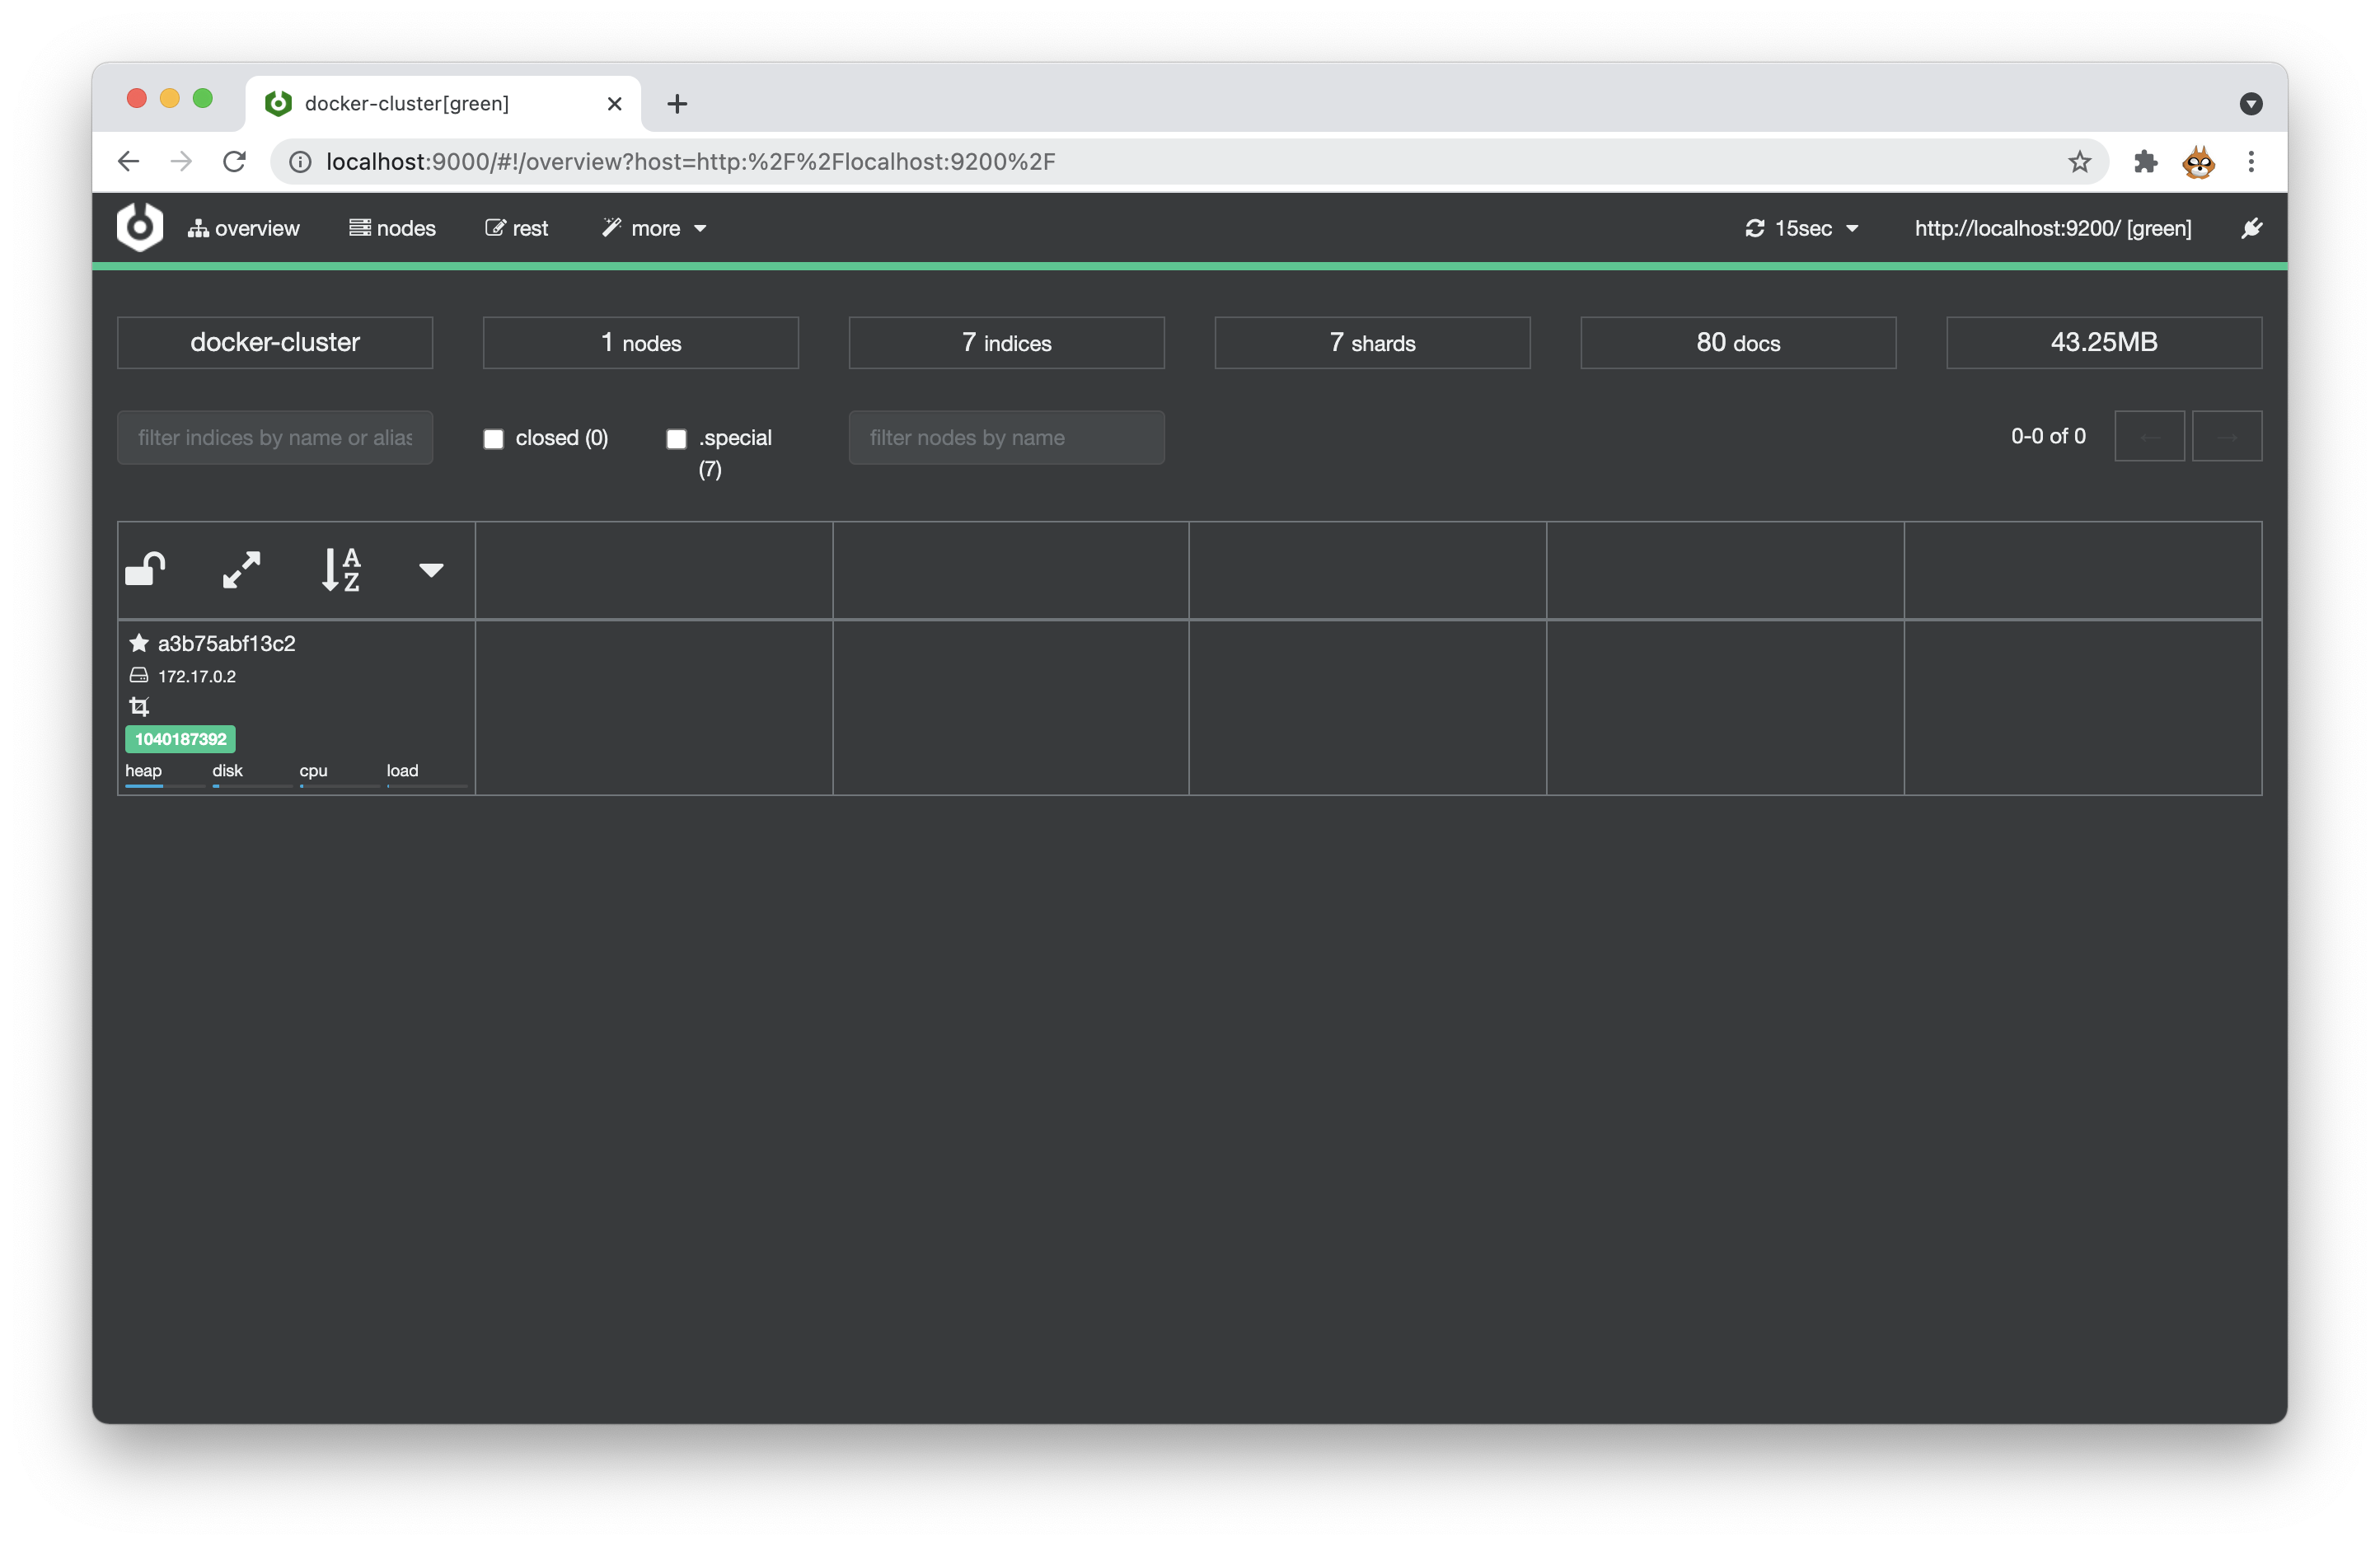
When the following screen appears, enter http://localhost:9200 in the Node address field.
If the following screen is displayed, the installation completed correctly.
Control everything at once
Create a docker-compose file
Create docker-compose-elastic.yml and write the following content.
version: '3.6'
services:
  elasticsearch:
    image: 'docker.elastic.co/elasticsearch/elasticsearch:7.14.0'
    container_name: es714
    ports:
      - "9200:9200"
      - "9300:9300"
    environment:
      - node.name="es01"
      - cluster.name="es-docker-cluster"
      - bootstrap.memory_lock=true
      - discovery.type=single-node
      - "ES_JAVA_OPTS=-Xms4g -Xmx4g"
    ulimits:
      memlock:
        soft: -1
        hard: -1
    networks:
      - elastic

  kibana:
    image: 'docker.elastic.co/kibana/kibana:7.14.0'
    container_name: kb714
    ports:
      - "5601:5601"
    environment:
      - ELASTICSEARCH_HOSTS=["http://es714:9200"]
    depends_on:
      - elasticsearch
    networks:
      - elastic

  cerebro:
    image: 'lmenezes/cerebro'
    container_name: 'cerebro'
    ports:
      - "9000:9000"
    environment:
      - "CEREBRO_PORT=9000"
      - "ELASTICSEARCH_HOST=http://es714:9200"
    networks:
      - elastic

volumes:
  data01:
    driver: local
  data02:
    driver: local
  data03:
    driver: local

networks:
  elastic:
    driver: bridge
Start, stop, and remove all services
Start command:
% docker-compose -f docker-compose-elastic.yml up -d
Stop command:
% docker-compose -f docker-compose-elastic.yml stop
Remove command:
% docker-compose -f docker-compose-elastic.yml rm
Check each service
Check whether Elasticsearch is running.
% chrome 127.0.0.1:9200
Check whether Kibana is running.
% chrome 127.0.0.1:5601
Check whether Cerebro is running.
% chrome 127.0.0.1:9000